Insight Focus
- Chinese PET exports continue to trend downwards amid lacklustre demand.
- European imports surged in Q1’23 hitting all-time highs, buyers stocked up on Chinese resin.
- US PET resin imports slowed as demand continued to cool, and buyers destocked.
China’s Bottle-Grade PET Resin Market
Monthly Exports
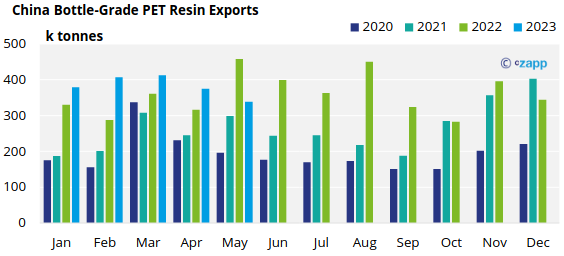
- Chinese bottle-grade PET exports (HS 39076110) totalled 339k tonnes for May, down by around 10% versus April levels, but 26% lower than a year earlier.
- Although May’22 experienced record export levels, following April COVID lockdowns, averaging over the two-month period still shows volumes declined by nearly 8% versus 2022.
- PET resin export demand continues to remain mediocre at best, and despite new capacity additions in May and June, exports are expected to remain around the 350k tonne level for June.
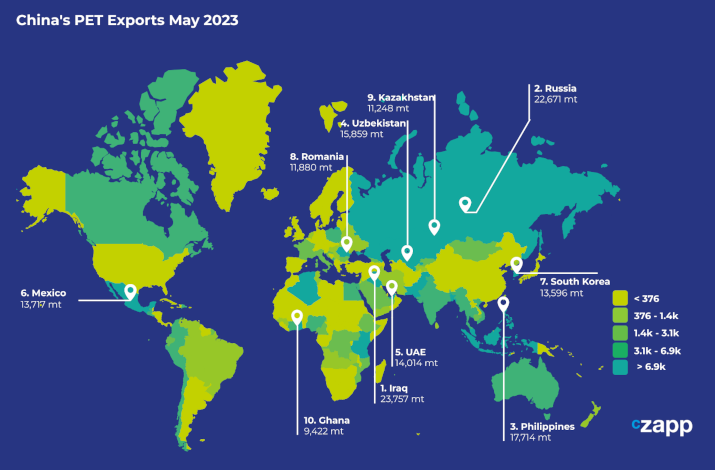
- Iraq, not a typical destination of note for Chinese resin, became the largest destination market in May with around 23.8k tonnes. The shipment is believed to be a single breakbulk vessel to a larger bottler in country.
- Russia was the second largest destination for Chinese PET resin exports in May with 18.2 k tonnes; whilst May volumes represented a 20% month-on-month decrease, exports to Russia were still up around 10% versus May’22.
- Central Asian flows also featured amongst the top 10 destinations in May, with over 15.8k tonnes to Uzbekistan and 11.2k tonnes to Kazakhstan.
- Exports to both Uzbekistan and Kazakhstan saw large gains in May, increasing 46% and 189% respectively versus April; 80% and 89% respective year-on-year increases.
- Exports to the Philippines also saw strong monthly gains, with volumes increasing 86% to around 17.7k tonnes.
- Other important markets for Chinese PET resin exports in May included the UAE, Mexico, and Romania.
EU Bottle-Grade PET Resin Market
Quarterly Imports
- EU-27 bottle-grade PET imports (HS Code 390761) totalled 367k tonnes in Q1’23, a 46% increase on the previous quarter and up 41% versus Q1’22.
- Top 5 origins in Q1’23 were the usual suspect of China, Vietnam, Turkey, Egypt, and South Korea, equating to over 88% of total EU imports from outside of the block.
- China was the largest source of imports, representing nearly 36% of total EU-27 imports in the quarter, with over 131k tonnes.
- Chinese Q1’23 imports rose by 149% on the previous quarter and 140% versus Q1’22.
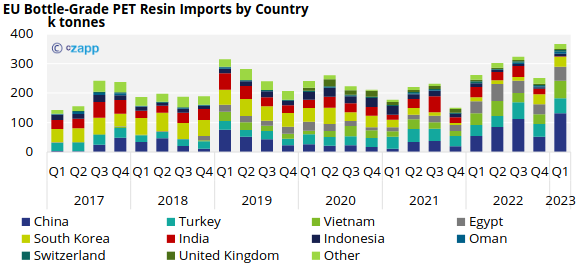
- Imports from other major origins also experienced large percentage increases, with Turkey, Egypt, and Vietnam increasing 20%, 79%, and 43% respectively versus the previous quarter.
- Imports from South Korea also gained considerably following a weak Q4’22, jumping by 143% to around 34.5k tonnes.
- Following March’s Notice of Anti-Dumping against Chinese resin into the EU, demand Chinese resin is expected to dissipate over the summer months; replaced with greater volumes from other key origins from Q3 onwards.
Quarterly Exports
- Extra-regional EU-27 PET resin exports declined once again in Q1’23, down 11% versus the previous quarter to around 48k tonnes, with European operating rates remaining under pressure.
- The UK remained the largest destinations for PET resin out of the EU block, one of the few destinations to show a volume increase.
- Exports to the UK (under HS 390761) reached over 33k tonnes in Q1’23, a 14% increased versus Q4’22, although 24% lower than a year earlier.
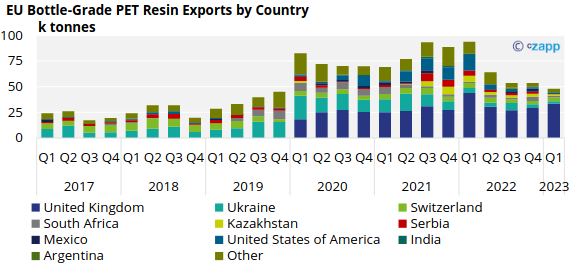
- Other destinations of note included, Switzerland, Ukraine, South Africa, and Kazakhstan, although volumes were small.
US Bottle-Grade PET Resin Market
Quarterly Imports
- US bottle-grade PET imports totalled 191.3k tonnes in Q1’23, down a further 10% on the previous quarter and 25% year-on-year.
- Since Q2’22 US imports have recorded three consecutive quarterly declines, with demand weakening through this period.
- Macroeconomic concerns, including persistently high inflation and increased interest rates, has meant most buyers have destocked, running on minimal inventories.
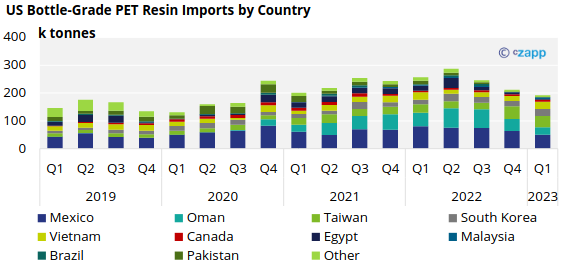
- Origins with the greatest volumes in Q1’23, include Mexico, Taiwan, Oman, and Vietnam.
- However, volumes from Mexico have continued to decline, falling a further 20% in Q1’23, down 37% year-on-year.
- Vietnam and South Korea were the only two major origins that saw volumes increase in the first quarter, up 48% and 33% respectively.
Quarterly Exports
- US bottle-grade PET exports totalled 13.5k tonnes in Q1’23, increasing 30% on the previous quarter and 37% year-on-year.
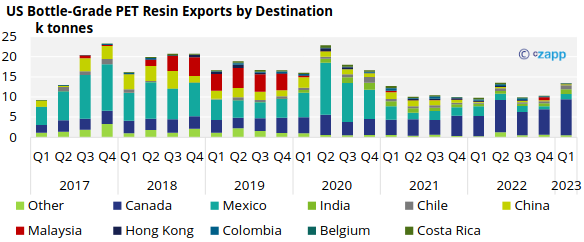
- Over 76% of the total export volume in Q1’23 remained within North America, with Canada the largest destination, followed by Mexico.
- Around 9k tonnes was exported to Canada in Q1’23, whilst a much smaller 1,3k tonnes went to Mexico.
- Resin also went to India, around 1.2k tonnes, in response to the tight domestic Indian market in the first quarter.