Insight Focus
- Global sugar production will exceed consumption this year.
- But refined sugar supply is very tight and raw sugar futures market is showing signs of stress.
- How do you explain this?
Production Surplus ≠ High Sugar Availability
We forecast that the world will produce 3.5m tonnes more sugar than it consumes in 2022/23. When combined with the 2021/22 season that is just ending, that’s almost 10m tonnes of surplus sugar.
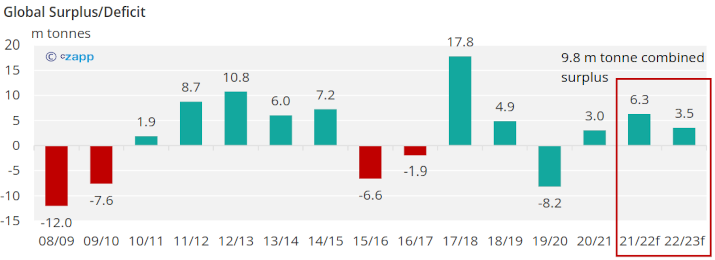
Yet both the raw and refined sugar markets are suffering from tightness in supply. Both markets are backwardated. The refined sugar market in particular is screaming for more supply, as shown by the October 22 contract expiring at the largest premium since August 2011.
The main explanation for this is that the global production surplus/deficit estimate does not take stocks into account. It doesn’t tell you if the sugar is available where or when it is needed, nor if it’s the quality that’s required.
Both the raw and refined sugar futures are FOB (free on board) contracts. They represent the value of physical sugar which is being loaded onto a bulk vessel at ports around the world. It therefore represents the value of sugar which can be traded and moved from sellers who are oversupplied to buyers who are undersupplied. A production surplus may not be available to buyers: for example if it’s held as government security stocks (China, Russia, India) or made within a country without the infrastructure to export.
Sugar is made from cane and beet; both crops have distinct harvesting seasons. Sugar production is therefore not evenly distributed throughout the year. Each region has its own season when sugar is produced, and many produce different quality sugars. This can further affect sugar supply.
It’s a similar story on the demand side. Major sugar buyers don’t always need to be consistent offtakers: they can choose to build or run down stocks. Final end-user consumption isn’t consistent through the year either. India is well-known for having higher consumption during festival season, and the same probably applies in the USA and UK during Christmas, Easter and Halloween.
For this reason, rather than use production/consumption statistics to manage sugar price risk, we look at the availability of FOB sugar at any given time, and also estimate the demand there is to buy it at current prices. If FOB supply exceeds demand this can be negative for price. If FOB supply is inadequate, this can be positive for price. We distil this down into a Trade Flow analysis, shown below.

These statistics are available on-demand for all Czapp Sugar Premium Analysis subscribers.
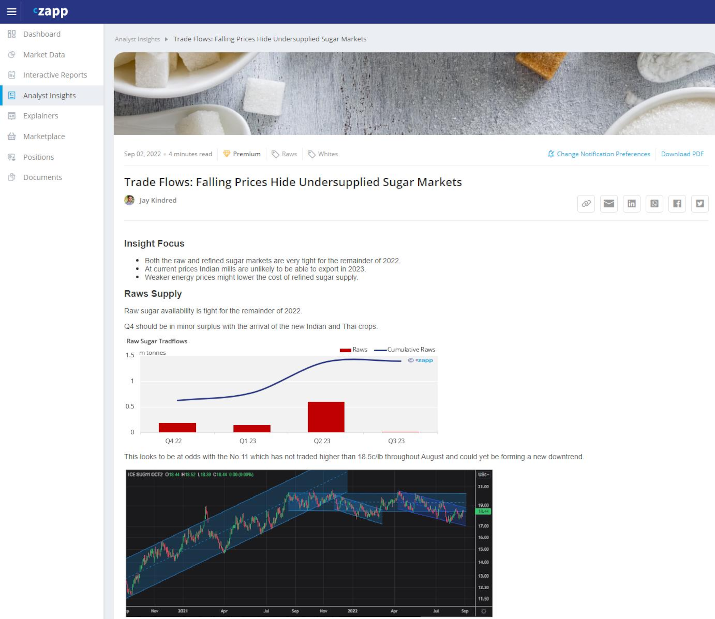
We also write a monthly Trade Flow Analysis Update for Premium Subscribers breaking down in detail the important factors driving sugar prices in the short to medium term. If you would like to find out more about this service and how it can help you manage your sugar price risk, please talk to Connor McGrath (cmcgrath@czarnikow.com).


