Insight Focus
- Fuel surcharge’s share of shipping cost quadruples so far in 2022.
- Far East to US East Coast surcharge rises more than to West Coast.
- Backhaul rates to Far East increase more than fronthaul.
The rise in crude oil prices that followed the Russian invasion of Ukraine is clearly seen in bunker fuel surcharges.
Across all trade lanes, average fuel surcharges have risen close to 50%, reaching almost USD 600 per FEU. Xeneta’s fuel surcharges include any surcharge related to bunkers, including but not limited to BAF, fuel recovery chargers, IMO 2020, Emission Control Area.
Above Average Rises
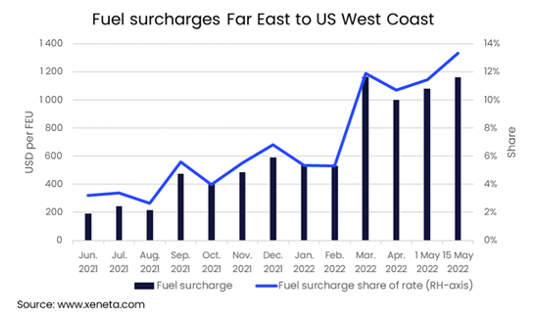
Some trades, such as the Far East to US West Coast, have seen an even larger increase in bunker surcharges, going from USD 540 per FEU in January 2022 to USD 1 150 in mid-May.
Compared to freight, the fuel surcharge’s share of the total shipping cost has climbed to 13%, up from 3% at the start of the year. This is due to the fuel surcharge doubling, as well as the base rate falling nearly 23% since the start of the year.

On the US East Coast, the fuel surcharge also accounts for a larger share of the total rate, up at 14% in mid-May (from 5% at the start of the year), averaging USD 1 450 per FEU, up from USD 650 on 1 January. The longer sailing distance explains the slightly higher increase in this surcharge compared to the West Coast: up 122% to the East Coast compared to 117% for the West Coast – while still making 16% and 13% of the total rate, respectively.
The fuel surcharges on the backhaul trades have increased by even more than those on the fronthaul – rising 245% from the US West Coast to the Far East and 128% from the East Coast since the start of the year.
Backhaul Surcharges Less Than Fronthaul
Despite these large increases, they remain a fraction of the fuel surcharges on the fronthaul: USD 190 per FEU and USD 200, respectively. As bunker prices remain high, these surcharges are unlikely to fall any time soon, and some shippers will be seeing even high surcharges. Even if they remain flat, they are likely to continue to account for an increasing share of the total rate as spot rates come down across the board.
Note:
The Weekly Container Rates blog analysis is derived directly from the Xeneta platform, and in some instances, it may diverge from the public rates available on the XSI ®-C (Xeneta Shipping Index by Compass, xsi.xeneta.com. Both indices are based on the same Xeneta data set and data quality procedures, however, they differ in their aggregation methodologies.
Other Insights That May Be of Interest…


