Overview
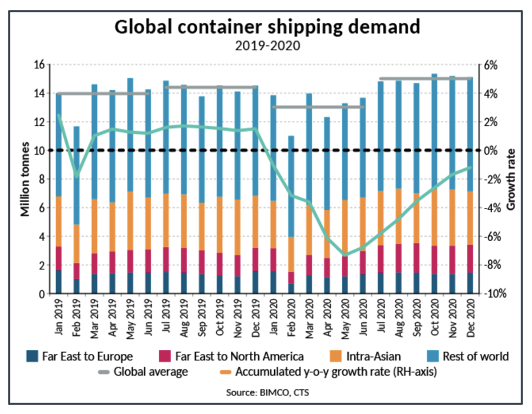
In 2020, global container shipping volumes fell by 1.2% year-on-year. This is much less than feared, even before the pandemic was first declared, and much recovered compared to the 6.8% drop recorded in the first six months of the year.
Volumes in the second half of the year were up 4.2% from 2019. Much of this growth was concentrated on just a few trade lanes, with congestion and imbalances on these spilling out and causing disruption on other trades.
We think 2021 will be even better for container shipping, as the current backlog will take months to clear and carriers are using the current strength of the market to lock in long-term contract rates for the coming 12 months at higher levels than in 2020.
By far the largest volume growth was seen on the Far East to North America trade. On this route, volumes rose by 3.6m TEU in the second half of the year compared with the first, while volumes rose 2.1m TEU compared with 2H’19; enough to bring full-year growth into the positive (+1.4m TEU).
The second half growth caused major disruptions in many US West Coast ports, as they were unable to keep up with record high volumes while implementing social distancing among workers at the same time. Furthermore, lower manufacturing and containerised exports in 1H’20 meant the imbalance on the trade got even worse, leading to equipment shortages as containers were stuck in the wrong places.
Weaker H2 Recovery on the Other Major Trades
Of the three most important, high-volume trades, the Far-East to North America was the only one to grow over the full year, as growth on intra-Asian and Far East to Europe trades in the second half of the year was not enough to make up for H1 losses. After falling 1.1m TEU in the first half of the year, volumes between the Far East and Europe were only up by 0.2m TEU in 2H’20, leaving full-year volumes on this trade down 5.2% year-on-year.On the Intra-Asian trades, a 2.2% growth in the second half of the year compared to H2’19 was not enough to recover a 4.0% loss in the first half.

There were only very few trades which bucked the trend and grew in the first half of the year. One of them was the Indian subcontinent and Middle East exports to the Far East; the thirteenth largest trade, which saw volumes increase by 115k TEU in 1H’20 compared to the same period in 2019.
The particularly strong recovery in demand for containerised goods in the US was driven by a rise in consumer spending, particularly on goods for the homes that people have been spending much more time in, as well as higher spending on goods as consumers were unable to spend what they usually do on services.
As manufacturing in consuming countries has struggled to recover to its pre-pandemic levels, imports have outgrown demand for a number of goods in order to fill the gap. This development is hugely beneficial for shipping.
Uptick in Volumes Soon Played Out on Spot Freight Rates
Freight rates did not experience the same drop as volumes did in the first half of the year, as carriers pushed losses onto tonnage providers. Charter rates did, however, fall steeply from mid-February to June.
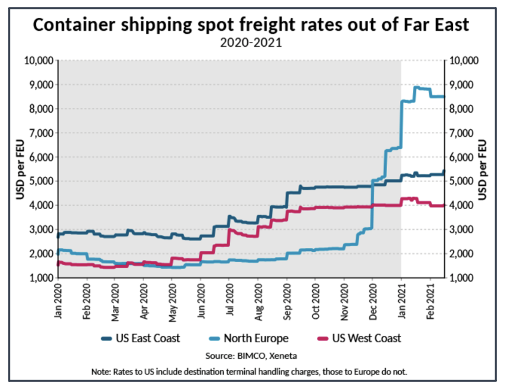
On the routes from the Far East towards the US and Europe, only spot rates to Europe fell over the course of the first half of the year, bottoming out in April at just under USD 1,639 per TEU, which was still higher than rates in much of 2019.
Once volumes started to rise, rates followed the upwards journey that would take them to the record high levels, which carriers are still enjoying today. The first increase in spot rates was seen on the Far East to US West Coast trade, as this was where the uptick in volumes happened first and fastest. As the scale of the recovery on this trade was uncovered and the idle fleet nose-dived as carriers added capacity to meet rising demand across the board, rates on other routes also started rising, first on Far East to the US East Coast, and then a couple of months later, a sudden jump in rates to Europe followed.

In recent months, the steep upwards path of spot freight rates on the transpacific trade lanes have stopped, partly due to intervention from the Chinese government. However, as demand has remained strong, and carriers still hold the upper hand, gradually increasing surcharges have been added to the base freight rates. This has stopped freight rates from rising further but left shippers with higher costs. As of mid-February, surcharges to guarantee space and equipment on the major trades stand between USD 1,500 and USD 2,500 per TEU.
Carriers Scrambling to Get Hold of Extra Tonnage
The sudden surge in demand for ships played out, not only on the spot market, but also on charter rates, which have seen a steep V-shaped recovery since June 2020, with rates for all ships considerably higher than their pre-pandemic levels. Charter rates for 6-to-12-month contracts currently stand at USD 13,700 per day for a 1,700 TEU feeder ship, USD 23,000 per day for a 3,500 TEU ship and USD 42,000 for an 8,500 TEU ship. Even at these rates, carriers are desperate to get hold of any extra tonnage they can, in many cases to ensure they can stick to their announced schedule, as delays in importing ports mean many ships are unable to make it back in time for their next scheduled departure.
High demand and earning potential for ships mean demolitions also fell considerably in 2020, with most of the demolition coming in only two months. Had demolition yards been open and able to operate normally at the height of the crisis in Q2 when demand for container ships reached its low point, demolition would no doubt have climbed upwards. As it happened, this was not possible and, instead, owners had to wait until June before they could get rid of any substantial tonnage. What followed was two months of higher demolitions, which saw 103,436 TEU leave the market (more than half of what was demolished in the whole year).
By the end of July, however, demolitions were once again all but stopped, as demand for container ships rose and many owners found that even their older and less efficient ships became very profitable. In the last quarter of 2020, only 7,448 TEU were removed from the market, all of which from feeder ships, down 70.9% from the same period in 2019.
At the same time, as demolitions slowed, contracting picked up, with 65 new ships amounting to 751,057 TEU being ordered. In the full year, the container shipping fleet grew by 2.9% as 857,616 TEU was added to the market, compared to 188,800 TEU being demolished.
The high earnings that carriers have achieved in recent months are not a reflection of better fundamentals in the container shipping market, but rather a result of how 2020 developed. In the longer run, this artificial tightness in the market will subside and container shipping will once again have to deal with the pre-pandemic overcapacity in the market, made worse by new orders made in recent months.
How Long Will It Last?
As carriers release their full year results, announcing profits of a size not seen for many years, heads are turning towards how this year will turn out, and here, more good news appears to be on the horizon.
Firstly, and most importantly, are the long-term contracts for this year, which have either been fixed in recent months or are still being negotiated. For all but the largest shippers, for whom carriers have in many cases rolled over last year’s rates in recognition that these shippers are too big to lose, long term rates will increase compared to last year. The current tightness in supply means carriers have the upper hand when negotiating these new contracts, and, although many shippers have initially been reluctant to sign new contracts, they will inevitably do so in the coming months. This will be done at high rates to the benefit of carriers, even if the spot market falls from its current highs.
The same goes for tonnage providers who are securing their ships on 6-to-12-month charters at today’s high charter rates.
As to the current disruption and equipment shortages, we think this will take at least until the middle of the year to be resolved, as a large backlog still needs clearing and equipment needs re-positioning.
In the coming weeks, we’ll publish our first shipping market overview and outlook of 2021, looking at container shipping as well as the general macroeconomic situation, dry bulk and tanker shipping.

Other Opinions You Might Be Interested In…
- Chinese Demand Keeps the Dry Bulk Market Going
- Freight Rates Nearly Triple After Strong Q2 Agricultural Exports
- Container Shipping: A Profitable Year in Challenging Times
- Tanker Shipping: Worst Not Over as Industry Pays for Strong Q2


