Insight Focus
- Russia’s invasion of Ukraine reshaped the commodity markets.
- We’ve used machine learning to demonstrate these changes.
- Energy markets are now more important than ever to commodities.
Market Segmentation
Let’s dive deeper into using machine learning in commodities. For those who aren’t familiar with this area of research, please start with our previous article.
To enhance our analysis from last time, we’ve expanded the range of commodities and increased the volume of data utilized. As a result, the correlations presented here will differ from those in the previous article.
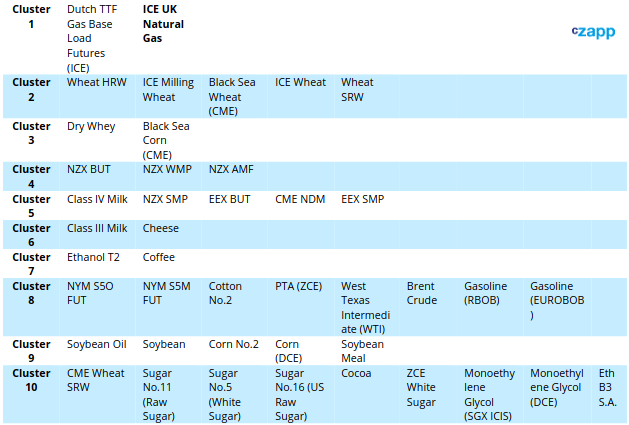
Our market segmentation algorithm, applied on the expanded commodity universe, was able to identify the following commodity groups:
Spurious Relationships
The algorithm has primarily identified seemingly logical groups of commodities. However, two associations may be spurious: the pairing of Ethanol T2 with Coffee and the Black Sea Corn with Dry Whey.
At an initial look, cotton’s association with the energy commodities might seem anomalous, but considering cotton often competes with synthetic fibres derived from oil, this relationship holds some fundamental merit.
Visualising Our Market Segments
We can show the results in a heatmap where:
- The value in each table entry corresponds to the rounded correlation coefficient,
- The colour of the entry indicates the magnitude of correlation – the darker the entry in the table the higher the correlation and vice versa,
- The heatmap has been structured so that clustered commodities are grouped together.
Network Representation of the Market
The next stage of our analysis involves creating a network-based model to represent our commodity universe. The model creates a space where each commodity, based on its return properties, has distinct coordinates. The model then aims to establish connections so that every commodity is linked to at least one other, while minimizing the total length of these links.
Interpreting the Chart
- Each node represents an asset.
- The node’s size reflects the average daily dollar volume traded.
- Highly connected assets occupy a central role in the commodity market.
- A shift in a central commodity can induce ripple effects on commodities it links to.
- Conversely, assets on the periphery have price movements that are somewhat isolated from most commodities.
- They may be influenced by unique factors not shared by other commodities in the dataset.
Finally, nodes have been coloured via their sector cluster as determined from our grouping algorithm.
Pre-Russian Invasion of Ukraine
We selected the six-month period leading up to the invasion on 24th February 2022 as the ‘pre-invasion’ phase for evaluation.
Before the invasion, the top four central commodities of our network were soybeans, soybean oil, corn, and gasoline (RBOB). As illustrated below, these four commodities create a chain linking the energy markets to plastics, sugar, grains and dairy.
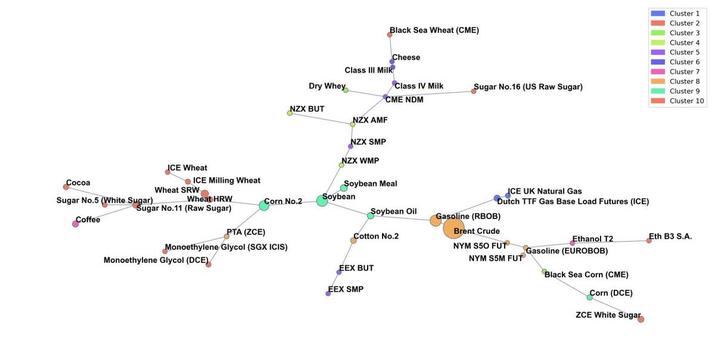
Each asset aligns closely with its respective clusters, and in certain cases, the segmentation appears even more refined. Notable examples include the connections between Ethanol T2 and Eth B3 S.A., as well as PTA and Mono-ethylene glycol.
Russian Invasion – “In a Market Crash All Correlations Go to 1”
We designated the one-month period following the invasion on 24th February 2022 as the ‘initial invasion’ phase for assessment.
During this initial month, the four most central commodities were Dutch TTF Gas Base Load Futures (ICE), Class III Milk, Gasoline (EUROBOB), and ICE UK Natural Gas.
A glance at the graph immediately reveals a pronounced departure from the market’s prior structure. Gas and gasoline futures now dominate the network’s centre, and what were orderly connections in the previous graph now appear more chaotic.
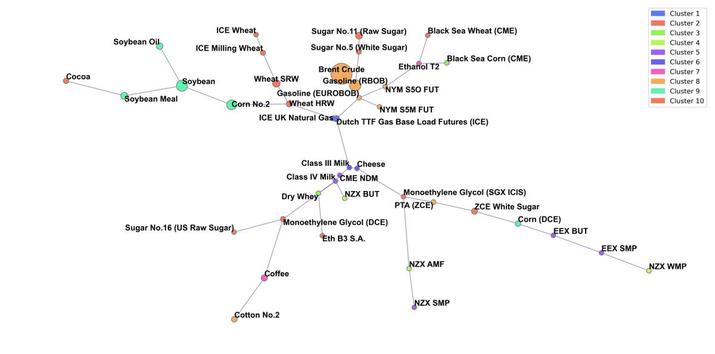
From a numerical standpoint, the network has contracted in size and displays enhanced connectivity, echoing the familiar market saying: “In a market crash, all correlations tend to 1.”
Notably, sugar undergoes a significant shift, with the No.11 transitioning from being four nodes away from any energy market commodity to being just one node (the No.5) away from Gasoline (RBOB).
Ongoing-Conflict – The New Normal?
For the final stage of our analysis, we selected the time frame from one-month post-invasion to the present day.
The progression from the previous graphs is striking. The Russia-Ukraine conflict has profoundly amplified the significance of energy within the global commodity complex.
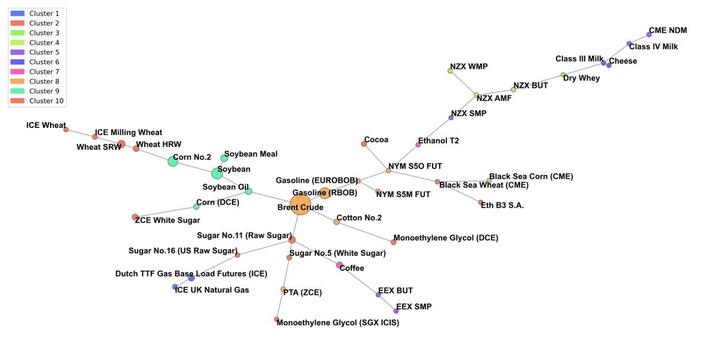
No.11 sugar now exhibits a closer relationship with energy than ever before and is directly linked to crude oil. The central role of energy markets seems firmly entrenched in the current landscape of the ongoing Russia-Ukraine conflict.
Intriguingly, the total distance covered by network model has increased, suggesting that commodity markets are less correlated now than before the crisis. This indicates that the Russia-Ukraine war has bolstered the resilience of commodity markets. Could it be that the market’s robustness has indeed grown in the face of adversity, driven by improved, diversified supply chains that are less dependent on Russian oil?
Conclusion
The ongoing Russia-Ukraine conflict has had significant impacts on commodity markets. Before the war, soybeans and corn were significant links for the whole commodity complex. But since the invasion their importance has diminished, and energy products have become central to the sector.
Everyone interested in commodities should keep an even closer watch than ever on the energy markets.


