1,158 words / 7 minute reading time
A Brief Overview
This is the final part of Czapp’s Introduction to Dairy. Across the series, we have talked about the markets of New Zealand, the USA and Europe. We’ve also focussed on specific dairy commodities such as skimmed milk powder (SMP), butter and cheese. To round things off, we’re talking about one last commodity; Whole Milk Powder (WMP).
The Standardisation Process
- Milk varies substantially in its composition, so certain guidelines are put in place by world food organisations. For instance, the Food and Agriculture Organisation of the United Nations (FAO) ensure WMP is between 26-42% milk-fat, and that it contains a minimum of 34% protein.
- Note: The Codex Alimentarius Commission was created by the FAO in 1963 to develop food standards, guidelines and related texts such as codes of practice under the Joint FAO/WHO Food Standards Programme.
- Fat and protein standardisation are common in locations where milk exceeds these minimum percentages.
- Lactose, milk permeate or milk retentate are added to the milk to standardise the protein content. Buttermilk is added for fat standardisation. All these additions occur prior to the drying process and are allowed as they maintain the whey/casein ratio found in milk.
- There is also usually a small amount of cream able to be separated from the whole milk prior to drying, so the stream for WMP is actually WMP/cream product (e.g. butter)/buttermilk powder, though the WMP price dominates this calculation.
- Fat-filled milk powder (FFMP) is the main competition for WMP at a consumption level.
New Zealand: The Dominant WMP Trader
- New Zealand and China Dominate WMP trading.
- In 2018, world WMP exports reached 2.5m tonnes and these are expected to grow again this year.
- New Zealand’s major dairy export product by volume is WMP, accounting for over half of all globally-traded volume alone.
- Expectations are for the 1.4m tonne mark to be reached out of New Zealand in 2019, possibly besting 2014 as the record volume year.
New Zealand’s WMP Exports
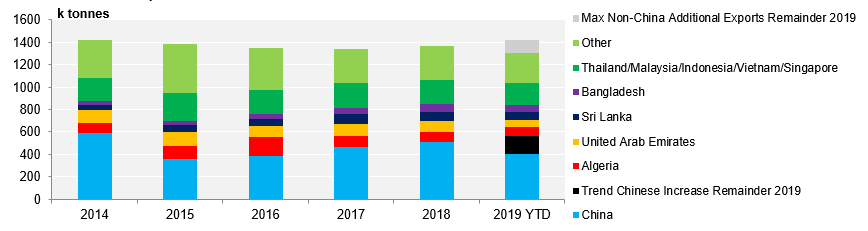
China: New Zealand’s Key Export Destination
- WMP imports are up 46% YTD (Jan-Oct) and New Zealand has just under 90% of the market share.
- China’s key demand period typically matches the peak supply period in New Zealand in Q4; they buy for the tariff-free period, with the product landing in January, in preparation for the high consumption period of Chinese New Year.
The Impact of the Earlier Chinese New Year
- Under the following assumptions I don’t think it’s out of the question to assume that an additional ~60k tonnes of New Zealand WMP could land in China above trend in 2019, bringing the total volume for 2019 up to 620k tonnes!
- Growing the displaced ~60k tonnes of powder which is not eligible for tariff relief at 11% (the trend growth rate).
- Apply a similar WMP/SMP split
- Applying New Zealand’s 90% market share
- This only leaves around 60k tonnes to go to all the other markets to close the year, assuming we see New Zealand match its previous record production of 2014 (unlikely, given the recent price spike only got legs in October). This supports the strength we have seen on GDT of late, as this may be the only channel buyers can currently secure volume at scale in the near term.
Other Important Geographies for WMP Trade
- The EU typically only make WMP to contract, as cheese is the preferred stream. When milk flows fall in Europe, marginal milk is likely to be taken from the WMP stream. Extra-EU exports hovered around 390k tonnes from 2012-2017 but saw large declines in 2018, which have continued this year. 2019 total exports are only anticipated to be ~290k tonnes.
- Argentina and Uruguay are both active competitors in the WMP market, with annual exports usually being over 100k tonnes each.
- Argentina has had materially lower milk production this year due to drought conditions in H1, though milk has now rebounded WMP exports are still down ~43% YTD.
- Uruguay is up 2% YTD but exports are now falling materially due to current dry conditions and a material herd contraction.
- Both have Brazil as the top destination for product, but can often be active in the Algerian government tenders.
- Algeria is a large importer of WMP, issuing government-run tenders for 20-30k tonnes at a time.
- Approximately 300kMT was imported in 2018.
- Although the Algerian government is currently taking steps to protect its local dairy industry, the nation remains a large importer and expectations are still for over 240k tonnes to enter in 2019.
Sources: FAO, CLAL, Bloomberg, NZX.com, EC MMO, USDA
A Technical Analysis of WMP (for the extra keen amongst us!)
You may not think that a technical analysis would work in a relatively illiquid market such as dairy, however, some interesting observations can be gleaned from the WMP chart (and other products) using weekly candles.
Fibonacci’s, other established price levels, moving-averages and MACD (looking only at the rolling second futures contract):
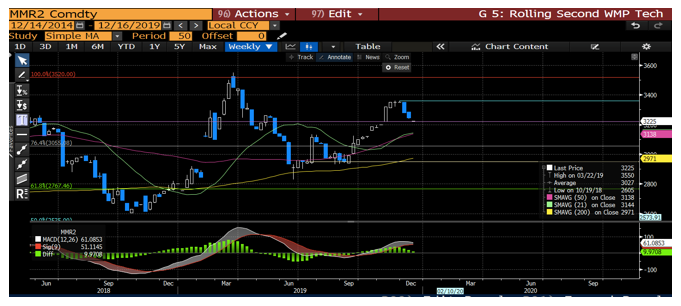
- The price has opened the week right on the historic support/resistance line of $3,255 (established in May-17).
- Simple moving averages maintain a weak buy signal after the 21-week made a bullish cut through the 50-week on the 22nd November. Both are very near $3,140 USD/mt. This could provide strong support if we breach the $3,255 level.
- The MACD (Moving Average Convergence Divergence Indicator) is also showing a weak buy signal. Look for this to potentially switch to a sell in the next fortnight.
- Volume was light in the September-December rally and has increased as price has declined, giving some strength to the bear camp.
GDT this Tuesday
- Last Thursday, Fonterra increased their offer quantity for WMP by 1k tonnes in this week’s event. The longer term forecast offer volume also saw an additional 13k tonnes (between January and April 2020).
- Both of these read bearish on the surface, but given the tightening fundamental picture described above, this may only briefly quell the upward price pressure and add further risk to price over the New Zealand shoulder.
This completes the seven-part introductory series on dairy. If there are any specific areas (countries, products, trade flows etc.) that you would like us to explore next please email in to WLangston@czarnikow.com. The next report will be published in early January.
I wish you all a Merry Christmas and a Happy New Year!