
Insight Focus
There has been a heavy sell-off in EUAs triggered by 22% plunge in natural gas prices. Gas has relaxed as the EU mulls looser storage mandates and US exports rise. Investors continue to hold significant long positions in anticipation of price recovery.
EU Carbon Prices Drop by 14%
European carbon allowance prices have tumbled in the last two weeks, shedding as much as 14% since February 12 amid a widespread sell-off in European energy markets, as worries over the region’s natural gas reserves have receded.
The benchmark December 2025 EUA futures contract peaked two weeks ago at EUR 84.25/tonne on the ICE Index Exchange but had fallen away to as low as EUR 72.67 as of February 20, a loss of 14%.
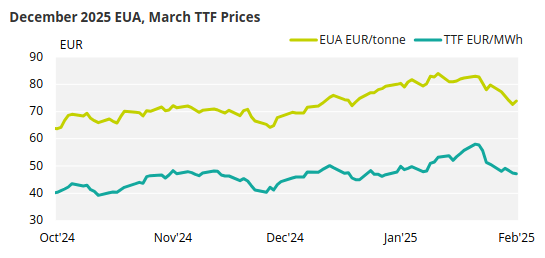
Source: ICE
Over the same period, front-month TTF natural gas futures plunged 22%, while German calendar 2025 electricity fell 14%.
Loosening of EU Gas Storage Rules
The decline in gas and carbon was attributed to several factors. Foremost among them was the news that some EU member states have started to press for a loosening of EU rules that require countries to fill gas storages to specific levels throughout the year and reach 90% full by November 1.
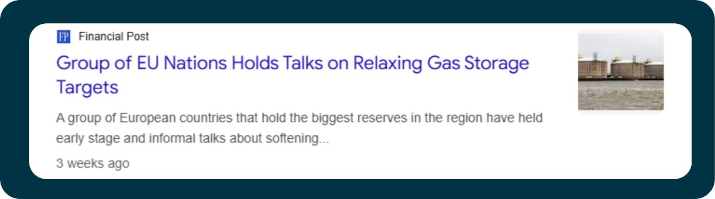
A more relaxed pace of refilling would likely calm the gas market, sources said, as traders would not be scrambling for supplies as urgently.
The market was also damped by reports that US liquefied natural gas exports are set to rise to near record levels, as Venture Global LNG and Cheniere Energy boost output from US Gulf export terminals.
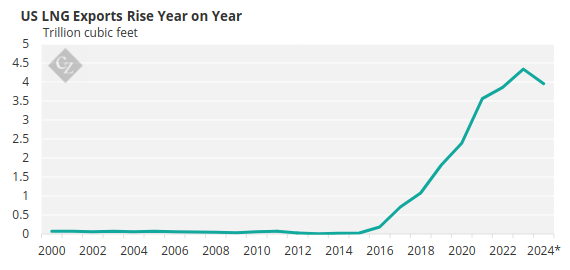
*to November
Source: EIA
European weather has also been growing slowly milder, lowering demand for heating fuel.
The long-running correlation between natural gas and EUAs remains a major driver in the carbon market. The 10-day rolling correlation among the two rose to +0.92 on February 21, after having been as low as +0.11 tend days earlier. The speculative frenzy in gas appeared to reach its peak on February 11 when prices rose to a record EUR 59.390/MWh, while EUAs continued to hover around the EUR 82-84 area.
Since then, however, both markets have been on a downward trajectory.
There has been little fundamental change in the demand for carbon allowances so far this year. With natural gas prices too high to be profitable for marginal power generation, this has left coal-fired power as the more advantageous fuel, sustaining demand for EUAs, but not materially adding to it.
Carbon markets sources pointed to further technical signals. After the benchmark contract failed to climb above the EUR 84-84.5 that was first reached at the end of January, the moving average convergence-divergence’s signal line moved into negative territory.
Likewise, the relative strength index peaked above 70, indicating an overbought market, at the end of January and has since moved down to levels more associated with oversold conditions, though not yet below the key 30 level. The price drop also brought EUAs close to two key technical levels representing the 100-day and 200-day moving averages, and the market’s failure to breach these supports allowed prices to “bounce” back slightly on February 21.
Analysts Speculate on Carbon Price Rally
However, sources suggest fundamentals may be starting to reassert themselves. Several analysts have speculated that the rally in carbon that started in mid-December in the mid EUR 60s may be based on a longer-term view of the market’s supply and demand balance.
Amid a widespread consensus that the annual supply-demand balance is likely to move into deficit as early as 2027, market participants expect speculative players to amass sizeable, long positions, as they did in 2018 and 2019 ahead of the launch of the Market Stability Reserve.
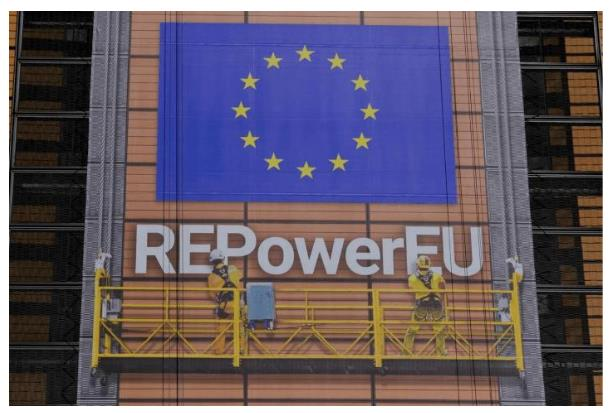
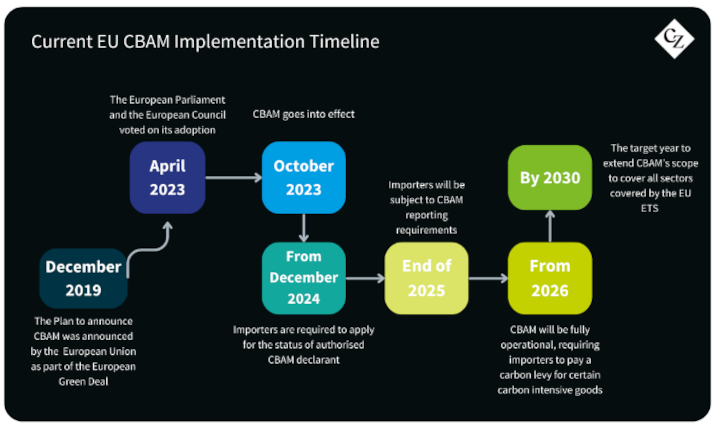
The REPowerEU initiative has brought forward the sale of at least 250 million EUAs to 2023-2026 from the 2027-2030 allocation, meaning that annual supply from 2027 onwards will be sharply lower.
Equally, the launch of the Carbon Border Adjustment Mechanism is expected to trigger more demand from European industrials as their free allocations of EUAs are reduced, while importers of raw materials that are subject to CBAM charges may hedge their exposure to these costs by buying EUA futures.
Some have suggested that the shift in investment funds’ positioning from a net short of 23 million EUAs in October 2024, to a net long of more than 60 million EUAs at the start of February – a three-year high – may represent the first stirrings of a funds’ move to position themselves for a significant price recovery based on these factors.
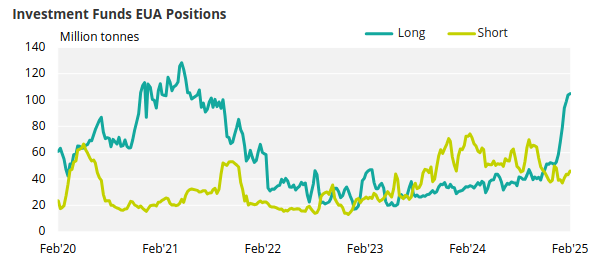
Source: ICE