- China’s sugar-free beverage market is growing fast.
- However, China’s set to produce a record 185mmt of soft drinks in 2021.
- Nevertheless, sugar consumption may dip as sugar-free products become more favoured.
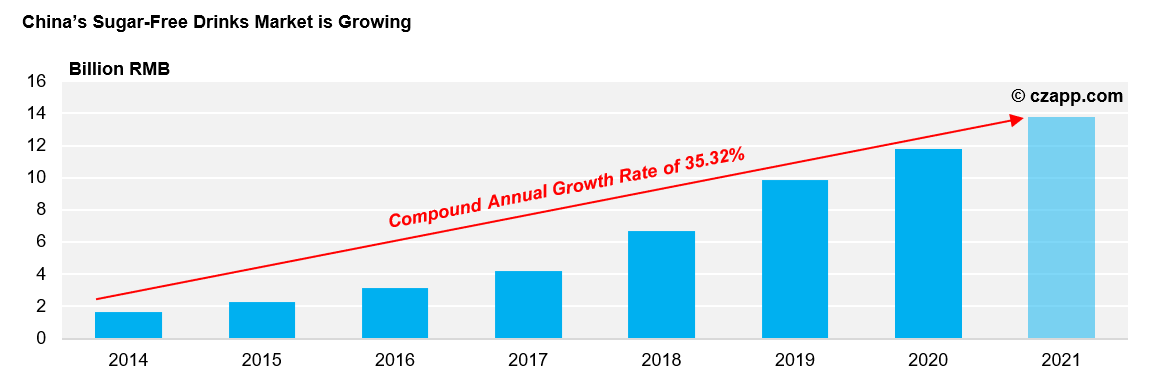
China’s Sugar-Free Drinks Market is Growing Fast
- Chinese consumers are becoming increasingly aware of the link between excessive sugar consumption and poor health.
- With this, we’re seeing China’s sugar-free drinks market grow each year.
- In 2020, the market was worth 11.78 billion RMB in 2020, up from 1.66 billion RMB in 2014.
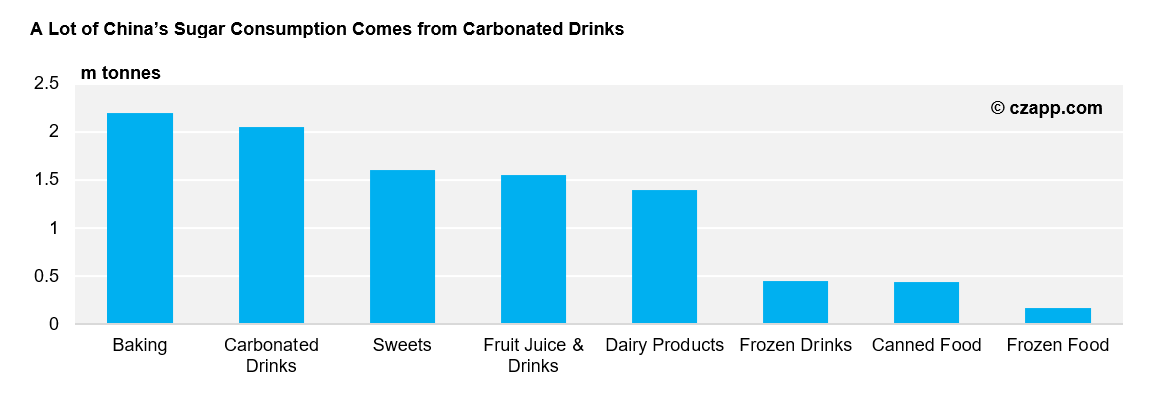
- Granted, sugar-free carbonated drinks account for just 6.4% of China’s total carbonated drinks production, but we’re still seeing signs of growth.
- If this growth continues, sugar demand from carbonated drinks producers may drop going forward.
- This’ll only be amplified by China’s increased use of High Fructose Corn Syrup (HFCS).
- We’ve seen a lot of producers turn to HFCS instead of sugar across the past decade because HFCS price is cheaper.
But…China Could Be On For Record Soft Drinks Production in 2021
- China produced 92.54m tonnes of soft drinks in H1’21, up 19% year-on-year.
- At this rate, it could produce a record 185m tonnes of soft drinks in total this year, up 13% from 2020.
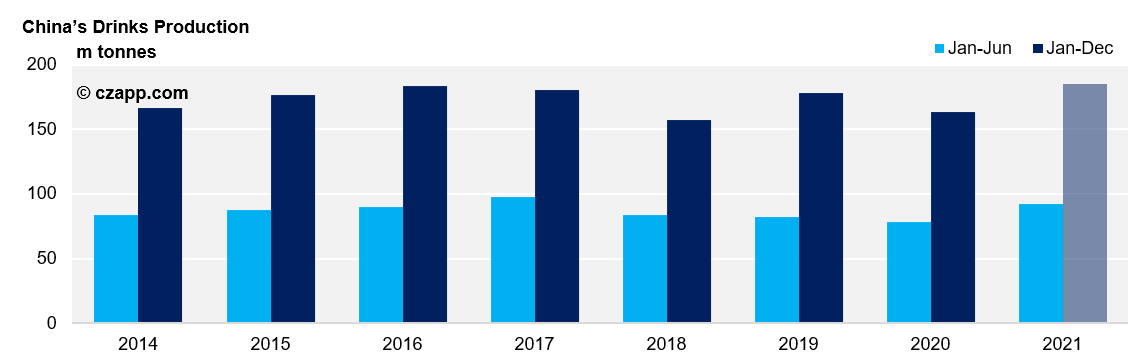
Note: This chart includes the production of all non-alcoholic beverages.
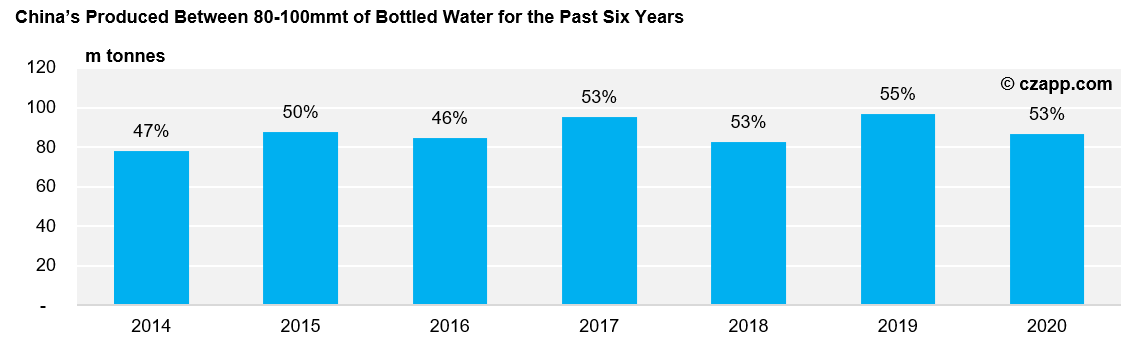
- Around half of this is packaged water production, which won’t help sugar consumption.
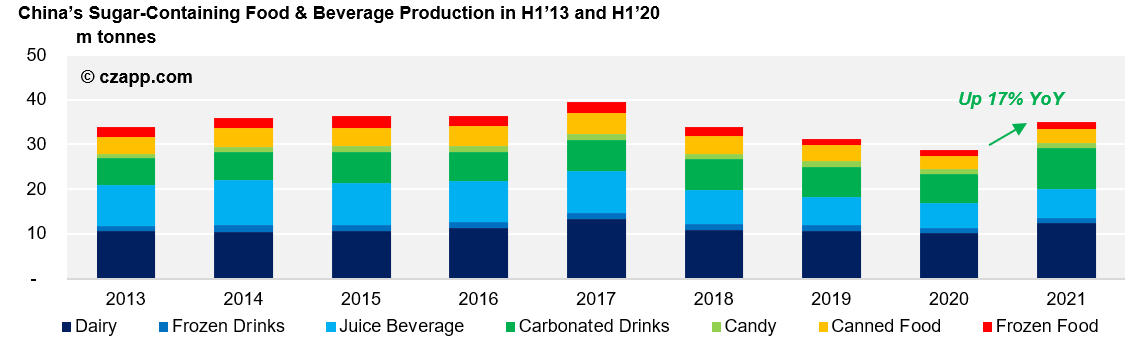
- However, most of the other drinks do contain sugar (carbonated drinks, fruit juice, etc).
- Their production is growing, only not by as much as it first appears in the below chart.

Other Opinions You Might Be Interested In…
Explainers You Might Be Interested In…