Insight Focus
Demand for US soybean oil is projected to grow. While ending stocks for 2024/25 are set to increase, this is only a marginal value and doesn’t justify a 9% year over year drop in soybean oil prices. In fact, US soybean oil is so cheap that demand should increase – so when will prices correct?
Soybean Oil Stocks Shrink
The National Oilseeds Processing Association (NOPA), the trade organization for the US soybean processing association, issued its November production statistics yesterday. Since September 2024 the sequential record monthly crush rate and record (by far) November soybean oil yield led to the lowest monthly stocks of soybean oil for the month of November in 10 years. If we threw out 2014’s stocks number, it would lead to the lowest stocks for the month of November in 20 years.
Wait. What? Record crush, record yield and oil inventories that aren’t growing? Correct. Allow me to explain with some background from the USDA.
Source: USDA
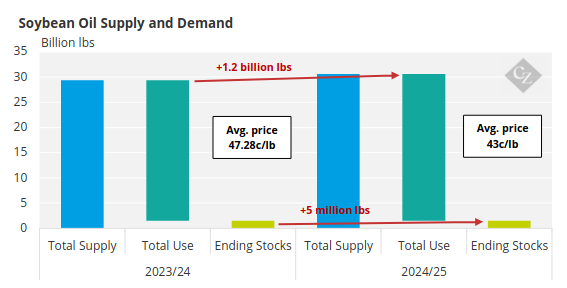
Consider the supply and demand data published by the Office of the Chief Economist of the USDA in association with the release of the December 10 WASDE report. He and his phalanx of PhD’s forecast ending stocks changing insignificantly versus a year ago: 1.506 billion pounds carried out (inventories in storage) at the end of September 2025 versus 1.501 billion pounds at the end of September 2024.
To put this change in year-on-year (YoY) ending stocks into perspective, USDA economists forecast total soybean oil production for the current October/September marketing year at 28.6 billion pounds. Dividing that production by 365 calendar days yields daily industry production of 78.37 million pounds. A change in ending stocks of 5 million pounds is insignificant, as in so small that economists could not accurately forecast that minuscule change.
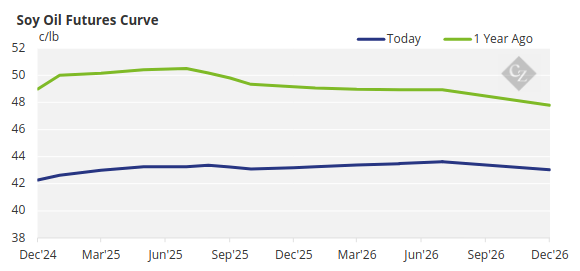
So now let’s look at the average for the year 43c/lb price forecast that USDA economists provided to the market with the updated December 2024 WASDE. On average across the entire Friday curve, USDA economists appear to have nailed the 43c/lb outlook.
Source: CME
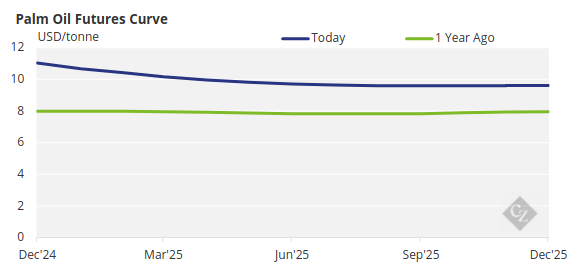
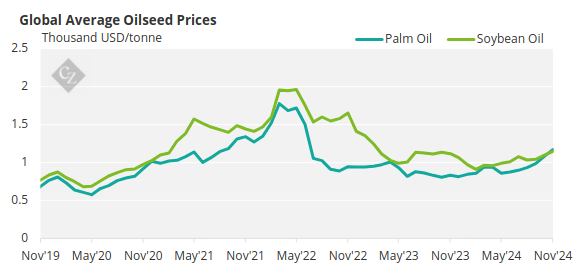
Also observe changes from a year ago to current for palm oil futures below. Soybean oil prices are down significantly versus a year ago, and palm oil prices are up significantly versus a year ago — more on this later.
Source: CME
Okay, two wins for team USDA so far. NOPA ending November soybean oil stocks increased a paltry 10 million pounds versus October and CME soybean oil prices hit on 43c/lb for the year. Everyone on the USDA oilseeds team can leave work 15 minutes early on Friday and this taxpayer won’t mind.
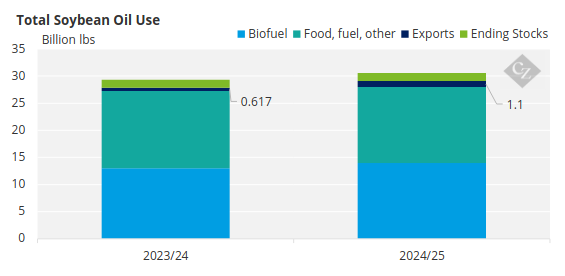
But what about that massive upward revision to the soybean oil export forecast in the demand part of the supply and demand table?
Source: USDA
While prescient in its stocks and price outlook so far for this October 2024/September 2025 marketing year, USDA economists missed their start of the marketing year outlook for US soybean oil exports by an enormous margin. No economist is leaving early now on Friday.
Consider this pricing chart that shows global average palm oil prices and global average soybean oil prices.
Source: World Bank
Vegetable Oil Supply Tightens
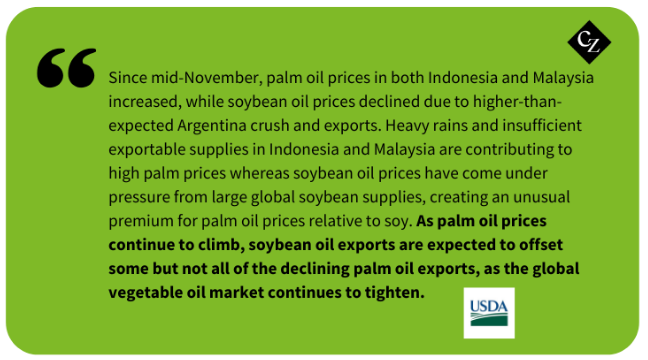
Palm is a large part of the increased US soybean oil export story, but the briefly mentioned tightening global balance sheet for all vegetable oils is as well.
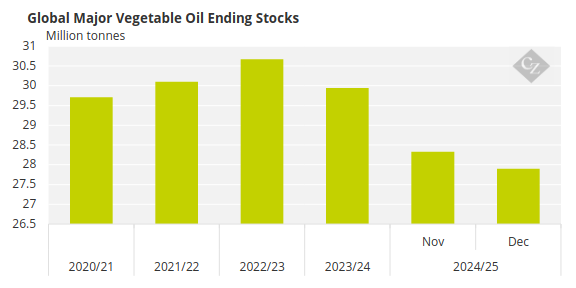
The December USDA Oilseeds: World Markets and Trade update takes ending stocks down to 27.9 million tonnes from November’s 28.33 million tonnes.
Source: USDA
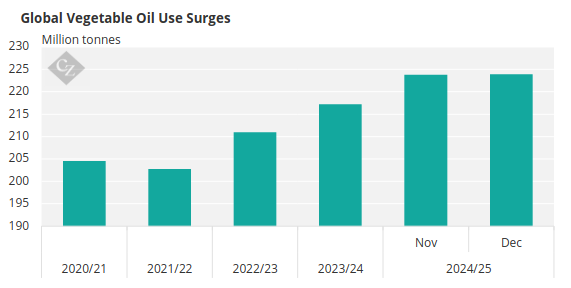
Usage goes up slightly to 223.88 million tonnes from November’s 223.86 million tonnes, so tighter stocks relative to increased usage for global supplies. Note too that ending stocks at 27.9 million tonnes indicate the tightest stocks in five years. Demand at 223.88 million tonnes represents the highest demand in five years.
Source: USDA
All this means there are tighter global supplies for all vegetable oils and a tight palm market, but limited USDA economist enthusiasm for US soybean oil prices. This is because US soybean oil exports will fill in “some but not all of the declining palm oil exports.” This despite the fact that US soybean oil is the cheapest in the world of all major vegetable oils?
And the USDA economists see prices for US soybean oil down 9% year over year to 43c/lb? Huh. And given the current CME soybean oil futures curve, which averages right at 43c/lb across the entire curve, they appear correct. It is a head scratcher.
Soybean Oil Prices Break Rules
For most professional agricultural commodity traders or risk managers, a forecast for stocks available at the end of the crop marketing year normally sets an expectation for a potential price range for the commodity.
The pros compare current prices to historic analogue years to conclude whether an agricultural commodity’s price is trading at a premium relative to available ending stocks, a discount, or is priced fairly. Per prior posts, most professional agricultural commodity traders consider the USDA forecasted ending stocks as the most significant pricing variable.
Ending stocks are identical to a year ago so the USDA economists’ price forecast should be identical, given 2024/25 is a near perfect analogue year to 2023/24, right? Nope. The mists forecasted prices 9% LOWER than a year ago. USDA sees this year’s average for US produced soybean oil at 0.43c/lb versus prices a year ago at 0.4728c/lb.
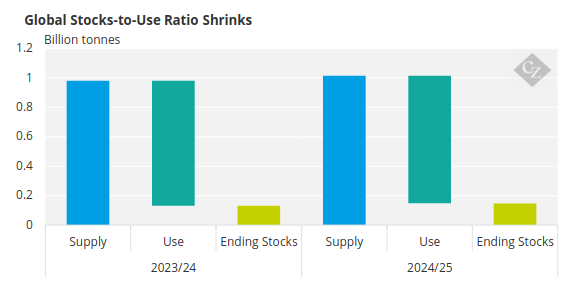
For 2023/24, the soybean oil marketing year just concluded at the end of September. Ending stocks finished at 1.501 billion pounds divided by 27.9 billion pounds of total demand, which generates a stocks-to-usage ratio of 5.3%.
Source: USDA
For the 2024/25 marketing year, USDA economists forecast ending stocks at 1.506 billion pounds, but demand increases to 29.1 billion pounds, dropping the ending stocks to usage ratio to 5.17%. Tighter availability of supply relative to demand and a 9% lower price forecast. Huh? That does not add up. But for now, USDA mists are right.
More Demand Could Appear
Expanding exports for the remainder of the marketing year remains possible given these two tail winds:
1) US soybean oil export prices are the cheapest in the world for all major vegetable oils and all major origins, and
2) Record imports of alternative feedstocks for the US renewable diesel industry to replace demand for soybean oil has not led to a stock build of soybean oil. USDA economists project that will not happen through the full marketing year to September 2025.
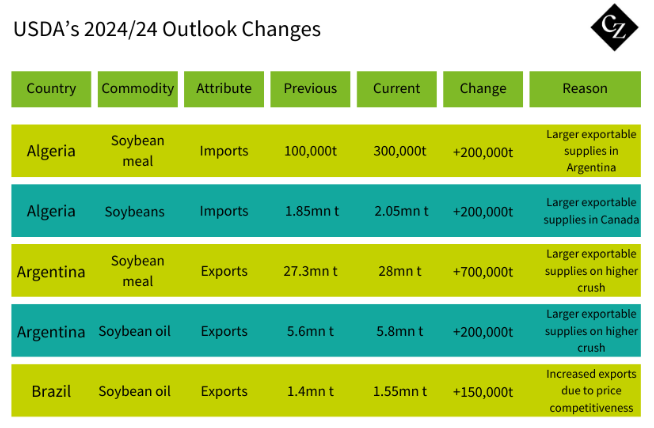
And it could be that USDA economists remain comfortable that Argentina (by far the world’s largest soybean oil exporter) and Brazil (the distant second) will have plenty to sell and reduce demand for US origin oil during their peak February-September harvest. USDA’s country-by-country detail in the Oilseeds: World Markets and Trade report lists its reasoning for higher December estimates for both origins’ exports.
I have omitted biofuels policy and the imminent policy guidance on key elements of the Inflation Reduction Act in regard to carbon scoring and tax credits for various renewable diesel and sustainable aviation fuel feedstocks. Bureaucrats in the halls of Washington, D.C. and Sacramento, California are making those decisions and we in the US soybean processing industry continue to wait for guidance.
In the free market world of global vegetable oil trade, however, US soybean oil remains the most inexpensive among all vegetable oils, and the world is coming to our door for more.
In the fundamental analysis world of stocks-to-usage ratios and comparisons of ending stocks to prices, the current market is a head scratcher.


