Insight Focus
- Corn used for ethanol also producing animal feed is often overlooked
- Share of US corn used for ethanol has fallen since 2012
- Biofuel mandates help stabilise prices, crop production
The food verse fuel debate is heating up and biofuels opponents and their supporters in the world of policy making (think tanks, government officials, universities) have reached out to their favourite journalists to express concern about food prices, food shortages, and proposals for reconsidering biofuel mandates globally. Last weekend the Financial Times (FT) ran this feature:
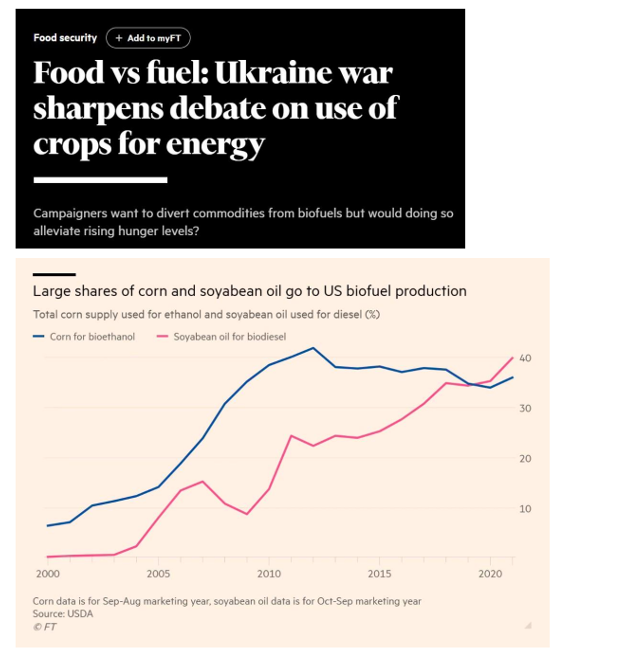
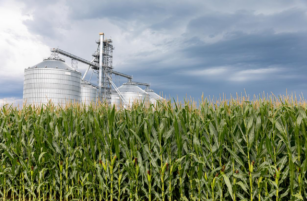
The FT featured the above chart to tell a story of “food” usage for “fuel” but failed to note a few important items that would have balanced the crisis tone. Let’s start with corn where the above chart clearly shows that ethanol industry percent usage of the total US corn supply peaked nearly 10 YEARS AGO. Repeat: 10 YEARS AGO! The percentage usage has trended lower since the 2012 drought reduced corn crop, i.e., corn for ethanol usage was higher in 2012 because the corn crop was smaller.
Corn productivity, not mentioned in the article, as calculated by the USDA to project current as well future trendline yields forecast ongoing productivity, that is, larger corn crops. The “capped” inclusion in of corn ethanol into gasoline as designed by policy imply this peak percentage remains in place for the foreseeable future (as well the declining percentage usage trend) unless and until policy changes.
As a quick aside (some of you will refer to this as a rant) the above chart and every other similar corn for ethanol usage chart that I have ever seen is incorrect because the chart maker (policy analyst, government official, ethanol opponent) simply takes the historic USDA corn usage for ethanol data and divides it by the USDA corn total supply data and drops it into a chart, easy peasy. It’s wrong. The correct percent usage formula is this: (USDA corn usage for ethanol data * 66%) / USDA corn total supply data. Why is that? 33% of the corn used for ethanol production comes back to the available corn supply side but in the form of dried distillers’ grains, a superior feed to whole kernel corn (most of the time trades at a 10%-15% premium to whole corn). My proposed “adjusted” chart would reflect the actual corn used for ethanol production and the percentage “food” usage would show significantly lower. Rant almost over: why the heck doesn’t the USDA present corn supply and demand tables this “adjusted” way? USDA’s current presentation of supply and demand data is flawed and needs to be adjusted.
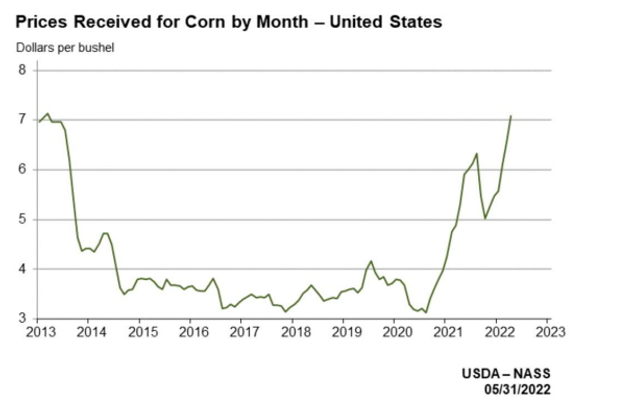
What about the volatility in prices that corn use for ethanol production has engendered? Ethanol opponents often suggest using corn for ethanol production has destabilized corn prices and led to unprecedented volatility and unpredictability of price movements. Hmmm. Look closely at the time series in the chart above. High prices from 2012’s 100-year drought in the US collapsed in 2013 and corn prices stabilized at around USD 3.50 per 56-pound bushel until last year when the inflation macro environment changed dramatically (as well Russia’s invasion of Ukraine) that spawned today’s doubling of prices. Ethanol opponents often overlook the stability and high predictability of corn prices of 2014-21 even while the US ethanol industry consumed approximately 40% of the corn crop.
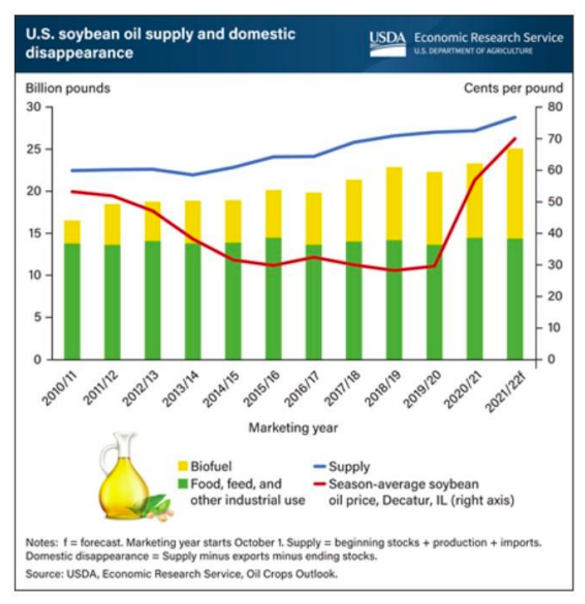
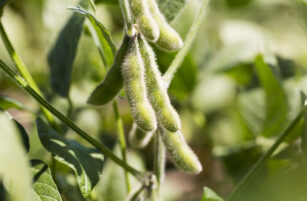
While ethanol opponents often ignore the predictability and stability of US corn prices during a LONG period of high percentage usage of corn for ethanol during the last seven years, we might anticipate that likeminded opponents to biodiesel and renewable diesel ignore the same stability and predictability of prices for those industries’ feedstock, soybean oil, as demonstrated in another USDA sourced and generated chart above (prices are the red line).
During this period of declining soybean oil prices (2010-14) followed by a period of stables prices (2015-20) the percentage usage of soybean oil total supply to produce biofuels trended HIGHER to 32% from 12%. Forward consumption forecasts by the USDA have the percentage usage of soybean oil for biodiesel and renewable diesel combined stepping up to 42% or 12 billion pounds of 28.8 billion pounds of available supply. Has this level of usage ever been tried before? Yes, corn for ethanol usage featured a similar percentage usage. Did this cause sharply higher prices and global volatility in prices? No, see the corn chart above for the empirical evidence.
The drums of policy change beat, the cries of outrage occur, but facts are facts, and time series are time series. Whether biofuels policy is a good idea or a misguided idea will continue to be argued in the halls of power by politicians and policy makers but the opponents cannot escape the empirical evidence of stability of corn and soybean oil prices and the predictability of those prices during the biofuels era. Using current high prices of all agricultural products to support regime change in biofuels’ policy is misguided; look at the entire period of biofuels policy and observe the real-world evidence.
The key reality that biofuels’ opponents, and their friends in power, must deal with today is this: the global sugar, corn, soybean, soybean oil, canola oil, rapeseed oil, and palm producer have ramped production to meet government mandates. Reconsidering policy, or worse, rescinding policy, puts those producers at risk for real economic collapse. Remember, these are the world’s food producers. Currently the world’s population cannot consume the amount of sugar, grain, oilseeds, and vegetable oils that stream into the biofuels markets. NOT even close. The market signal necessary to sharply restrict biofuel feedstock crop production would require a collapse in prices and broad carrying charge/contango price structures to promote the financial carry of these now “not needed” feedstocks. In short, economic ruin across large swaths of global agricultural production. Economic ruin would impact all global agricultural biofuel supply chain producers:
- Farmers
- Seed suppliers and designers
- Agricultural equipment makers
- Transportation providers (truck, rail, barge, and ocean freight companies)
- Lenders (agriculture banks would suffer dramatic spikes in non-performing loans)
- The list goes on and on.
The world has enjoyed years of surplus foods and stability of prices during the period of biofuels production and expansion. Farmers globally and consumers globally will respond to current inflation-driven high prices thoughtfully if they understand policy certainty. Calls for biofuels reform may make sense if thoughtfully considered; calls for the cessation of biofuels production in response to today’s prices would cause unimaginable economic damage and, in time, put the world at significant food supply risk.
For further information, please email waltercronin@msn.com.