Insight Focus
- Chinese PET exports jumped higher in August bucking mid-summer slump.
- EU imports record bumper first-half as Vietnamese and Egyptian imports accelerate.
- Experiencing weak demand through H1, US imports continued to decline.
China’s Bottle-Grade PET Resin Market
Monthly Exports
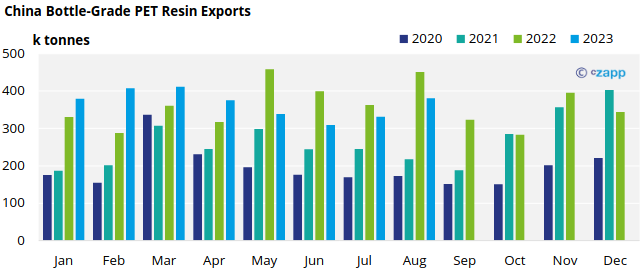
- Chinese bottle-grade PET exports (HS 39076110) totalled over 380k tonnes in August, up 15% on the previous month and 16% down versus a bumper August 2023.
- This month bucked the trend of subdued monthly export volumes seen over the previous 3-months, with levels languishing below 340k tonnes.
- Given the slowdown in new order intake, Chinese exports may repeat a similar pattern to the previous year, which saw exports surge in August before falling back in September.
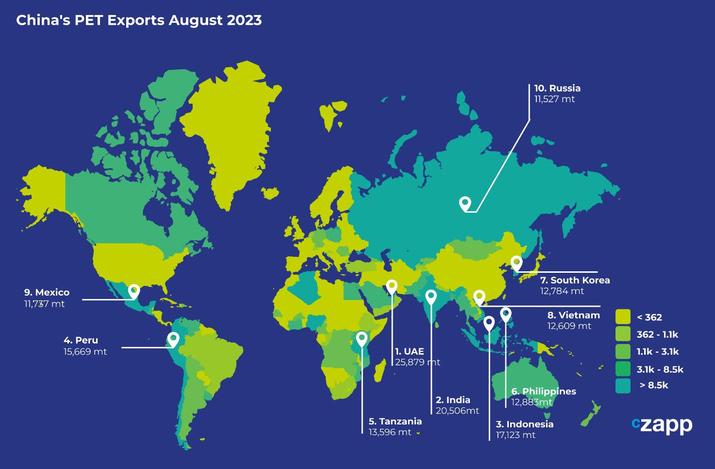
- The United Arab Emirates was the largest destination market in August with around 25.9k tonnes, a monthly increase of 27%, and more than double volumes seen the same time a year earlier.
- The UAE is also currently the second largest destination for total Chinese PET resin exports year-to-date, with exports through the first 8-months of 2023 up over 10%.
- Despite anti-dumping measures against Chinese resin, India was the second largest destination in August, with more than 20.5k tonnes. This is attributed to the one Chinese PET resin producer on a lower comparative tariff.
- Exports to South East Asian countries have also continued to increase, with Indonesia, the Philippines, and Vietnam all in the Top 10 destinations ranking for August.
- Year-to-date Chinese exports to ASEAN nations have risen by over 35% versus the same period last year. The Philippines is the only nation to see volumes drop YTD.
- Given massive new capacity in China, and increasing trade barriers in key markets, volumes to South East Asia are likely to see a steep increase over the next year.
- Expect to see increased competition in South East Asian markets even those with domestic production, which may instead pivot to greater export share.
EU Bottle-Grade PET Resin Market
Quarterly Imports
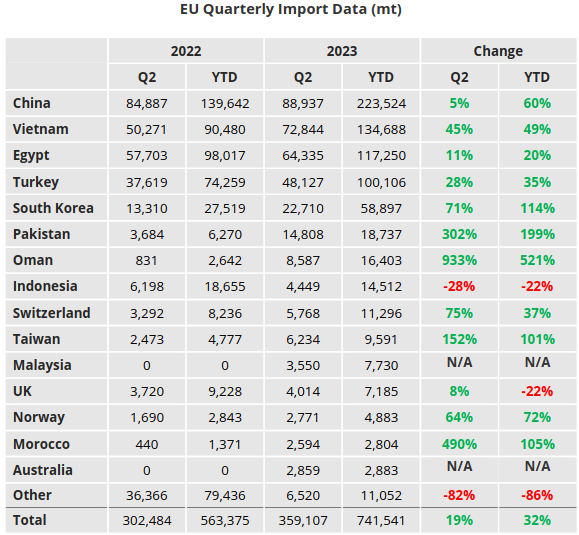
- EU-27 bottle-grade PET imports (HS Code 390761) totalled 359k tonnes in Q2’23, a 6% decrease on the previous quarter yet up 19% versus Q2’22.
- Over the first 6-months of 2023, the EU27 block imported around 742k tonnes of PET resin, 32% higher than the previous year.
- Top 5 origins in Q2’23 included China, Vietnam, Egypt, Turkey, and South Korea, equating to over 83% of total EU imports from outside of the block.
- However, Chinese imports slowed significantly through Q2’23 as a result of the ADD Notice at the end of March. Chinese imports in Q2’23 fell to 88.9k tonnes, down 34% on the previous quarter, although still up 5% on Q2’22.
- Latest July data shows imports from China at their lowest monthly volume of just 11.6k tonnes.
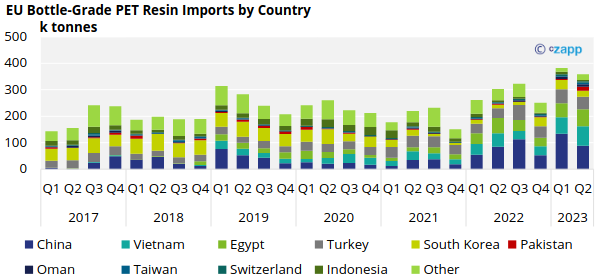
- Imports from other major origins continued to experience increases in market share at the expense of reduced Chinese flows.
- Vietnamese and Egyptian imports have accelerated increasing 18% on Q1, up 49% and 20% year-to-date versus H1’22.
- Although recording strong H1’23 increases overall, imports from South Korea and Oman dipped in Q2’23, drawn away into a tighter more lucrative US market.
- Other origins such as Turkey and Taiwan also continued to perform strong into the EU27 block.
Quarterly Exports
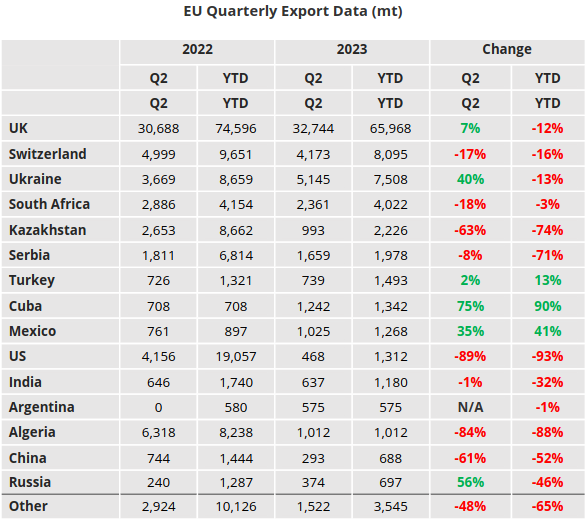
- Extra-regional EU-27 PET resin exports increased modestly in Q2’23, up 15% versus the previous quarter to around 55k tonnes, with European production remaining constrained.
- The UK was once again the largest destinations for PET/rPET resin out of the EU block.
- Exports to the UK (under HS 390761) were just under 33k tonnes in Q2’23, a 1% decrease versus Q1’23, and 12% down year-to-date.
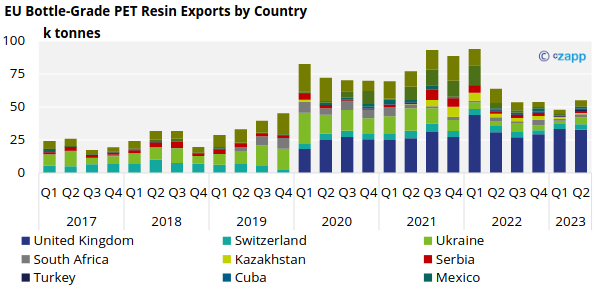
- Other destinations of note included, Switzerland, Ukraine, South Africa, and Kazakhstan, although volumes were comparatively small (under 5k tonnes).
US Bottle-Grade PET Resin Market
Quarterly Imports
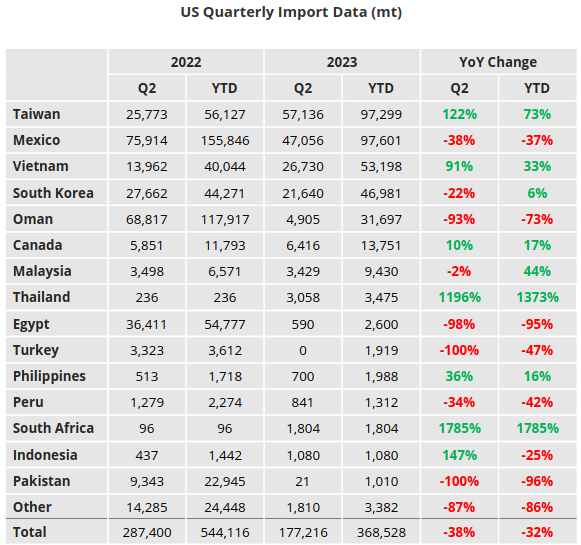
- US bottle-grade PET imports totalled 177k tonnes in Q2’23, dropping a further 7.4% on the previous quarter and down 38% year-on-year.
- Overall, first half imports were also down sharply versus the previous year, down 32% to 369k tonnes.
- US imports have now recorded four consecutive quarterly declines, with demand weakening through this period.
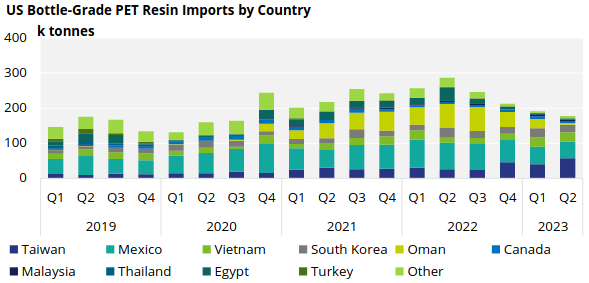
- Origins with the greatest volumes in Q2’23, include Taiwan, Mexico, Vietnam, and South Korea.
- Taiwanese resin has increased its share of US imports over the six months. Whilst flows from Mexico have quietened down due to strong domestic demand, and Omani imports has dried up significantly.
- Latest date shows July volumes were relatively flat on the previous month, although a pick-up in Korean imports is noted.
- A late summer demand surge is also expected to be reflected in future import data when released.
Quarterly Exports
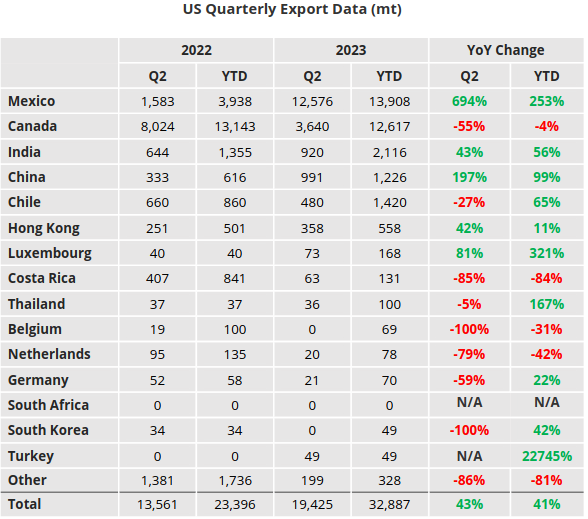
- US bottle-grade PET exports totalled 19.4k tonnes in Q2’23, increasing over 44% on the previous quarter and up 43% on the same period a year earlier.
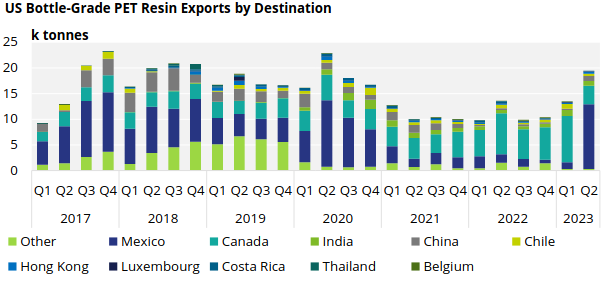
- Over 83% of the total export volume in Q2’23 remained within North America, with Mexico trading places with Canada this quarter as the largest destination market.
- Around 12.6k tonnes was exported to Mexico in Q2’23, whilst just 3.6k tonnes went to Canada.
- Going forward, the recent sharp increase in Mexican import Tariffs on PET resin from a range of Asia origins, and subsequent domestic price increases, are likely to benefit increased flows from the US.
Data Appendix
If you have any questions, please get in touch with GLamb@czarnikow.com.
