Insight Focus
- Chinese PET resin producers post bumper November export levels.
- Malaysia imports gain ground in Brazil as exports remain at historic lows.
- Thailand PET resin exports pivot towards higher margin US and Japanese markets.
China’s Bottle-Grade PET Resin Market
Monthly Exports
- Chinese bottle-grade PET exports (HS 39076110) surged to over 475k tonnes in November, increasing 27% on the previous month, and 20% above levels seen a year earlier.
- This leap correlates with the previously reported large order intake in October, although much will also have been for Q1 forward business.
- New order intake in November is also thought to have been more than 400k tonnes; combined with previous bookings, first half December exports are also expected to be strong.
- However, the ongoing crisis in the Red Sea has delayed and disrupted flows will have a direct impact on export volumes late December and into January, ahead of Chinese New Year.
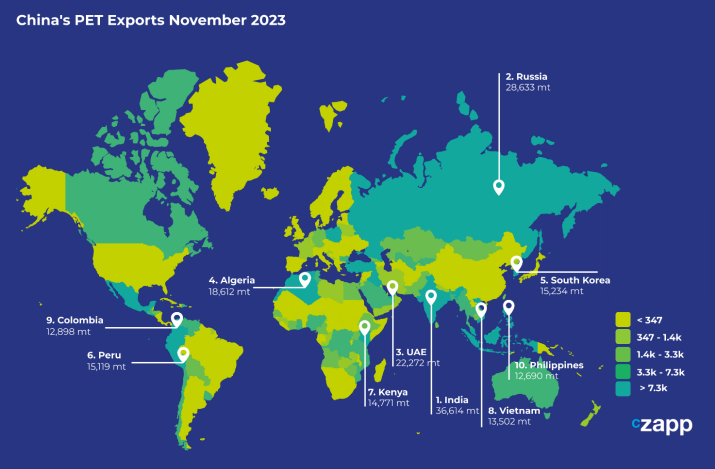
- The pace of Chinese material flowing into India continues to increase, with India the largest destination market in November, despite anti-dumping measures.
- Chinese customs reported 36.6k tonnes of PET resin exports to India in November, 55% up from the previous month, and an eyewatering 622% higher the Nov’22.
- Year-to-date exports to India have risen nearly 1100%, around 190k tonnes.Russia was the second largest destination, also increasing strongly versus the previous month, up 134% to 28.6k tonnes.
- Restocking activity in Algeria and East Africa, taking advantage of low prices, was also prevalent.Exports to the UAE reached 22.3k tonnes, whilst Algeria and Kenya accounted for 18.6k tonnes and 14.8k tonnes respectively.
- December and January volumes to these destinations are going to be amongst the most heavily impacted due to the Red Sea situation.
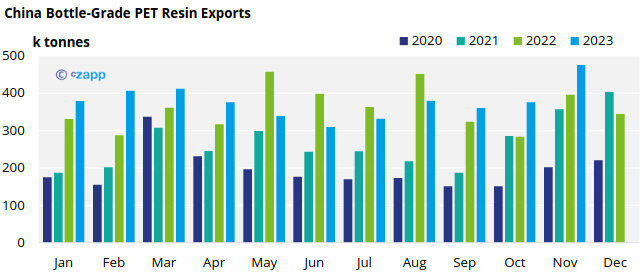
- Whilst West Coast LMonthly Exportsatin America continues to be an important sink for Chinese resin, exports to Southeast Asia have also been a natural outlet for the large increases in Chinese production in 2023.
- Indonesia, Vietnam, and Malaysia have all seen large increases year-to-date, 86%, 130%, and 22% respectively.
- In the November figures, Vietnam ranked 8th with around 13.5k tonnes up 35% from the previous month, and 73% for a year earlier.
Brazil’s Bottle-Grade PET Resin Market
Quarterly Imports
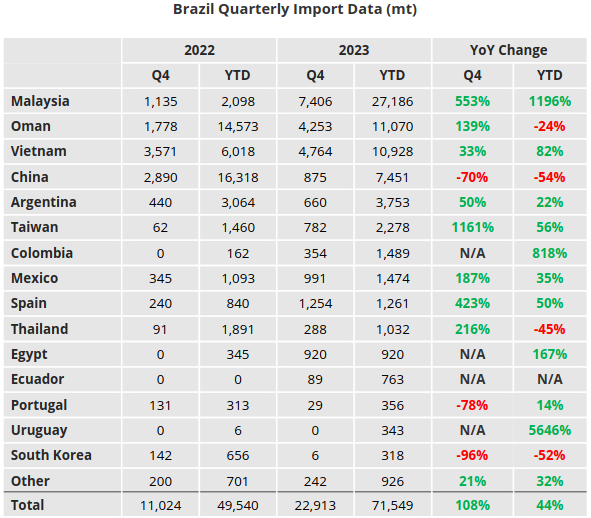
- Latest Q4’23 trade data for Brazil, shows a strong increase in imports to 29.9k tonnes, 51% above the previous quarter and 44% year-on-year.
- Approximately 72% of total Brazilian PET resin imports in Q4 originated from Malaysia, Vietnam, and Oman, with 7.4k tonnes, 4.8k tonnes, and 4.3k tonnes respectively.
- For full year 2023, Brazil imported 71.5k tonnes, 44% up on the previous year, and only 3% on 2021’s record year.
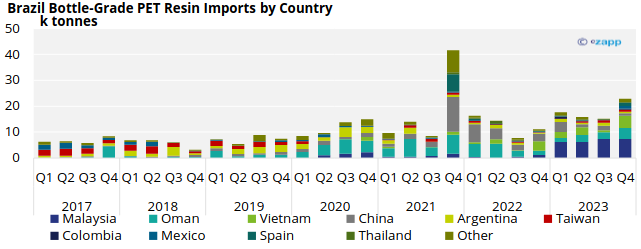
- Malaysia was the largest import origin for the full 12-moth period, clocking a total of 27.2k tonnes, a huge 1196% increase on 2022’s total.
- Vietnamese volumes also surged, up nearly 82%; Omani and Chinese volumes fared worse, falling 24% and 54% respectively.
Quarterly Exports
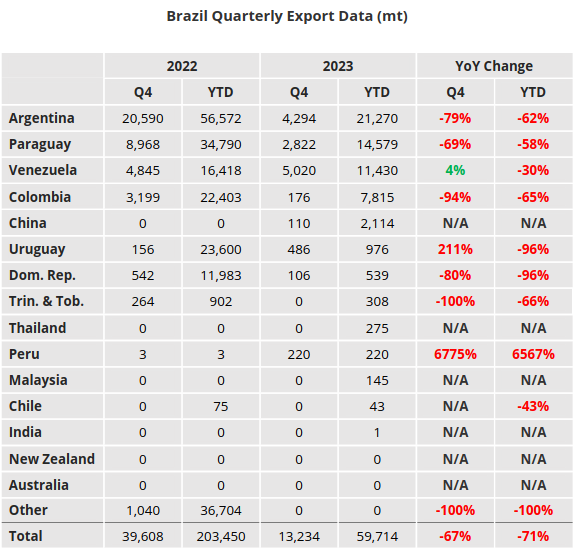
- Brazilian PET resin exports remained at historic low levels in Q4’23, totalling just 13.2k tonnes for the quarter, 67% down on Q4’22.
- Exports were almost exclusively destined for Venezuela, Argentina, and Paraguay, which when combined accounted for around 92% of total quarterly exports.
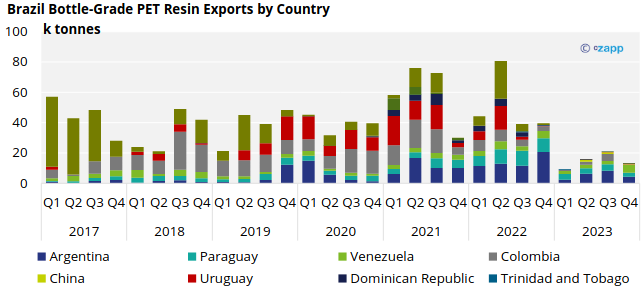
- For the full year 2023, total Brazilian exports fell to just 59.7k tonnes, down 70% on the previous year. There were no volume increases to any major target market.
- Exports to Argentina, the largest market in 2022, fell 62% down to a little over 22k tonnes; exports to Uruguay almost dried up entirely, at less than 1k tonne in 2023, compared to 22.4k tonnes the previous year.
Thailand Bottle-Grade PET Resin Market
Quarterly Exports
- Whilst we wait for December’s Thai data to conclude the year, below is a summary for the previous full quarter.
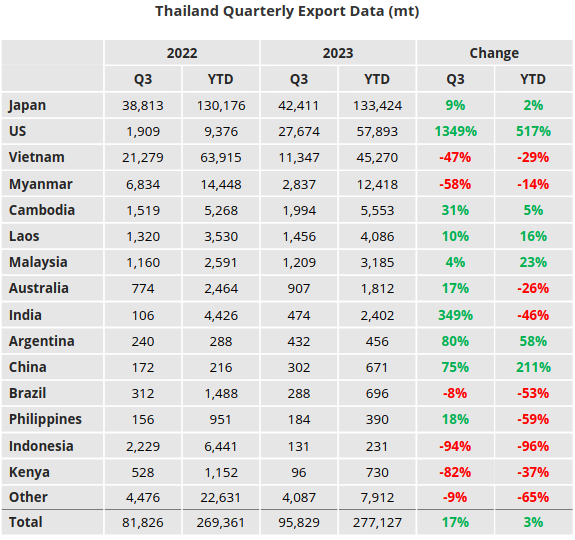
- According to Thai Customs, in Q3’23 Thailand exported a total of 91.6k tonnes of PET resin (HS 390761) in Q3’23.
- The top three countries captured around 89% of all exports, these included Japan, the US, and Vietnam, with 42.4k tonnes, 27.7k tonnes, and 11.3k tonnes respectively.
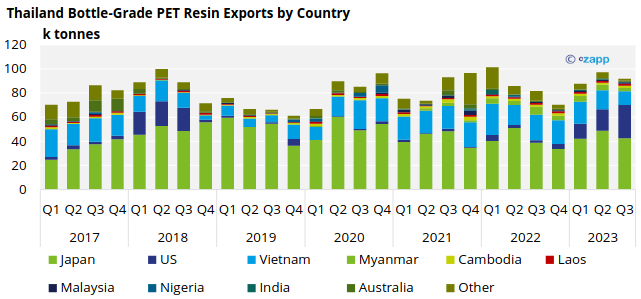
- Although Japanese volumes were down 13% on Q2, exports improved 9% on the same period a year earlier and were up around 2% year-to-date.
- Exports to the US had also gained steam on every metric, rising 55% from Q2, and up over 500% year-to-date.
- In some markets that were not protected from Chinese imports, and the latest wave of capacity expansion, Thai exports lost ground.
- For example, exports to Vietnam fell 27.5% in Q3’23, and were down 47% versus Q3’22, and down 29% year-to-date.
- Despite the downstream industrial links to Thai industry in Vietnam, cheaper Chinese resin has made ground, as Thai producers sought higher netbacks from the US and Japan.
Data Appendix
If you have any questions, please get in touch with GLamb@czarnikow.com.


