Insight Focus
China PET export levels keep elevated in April, exports now facing freight market chaos. EU imports continue to recover into 2024, with Vietnam remaining the largest import origin. US bottle-grade PET resin imports slow in Q1 amid soft demand, higher domestic production.
China’s Bottle-Grade PET Resin Market
Monthly Exports
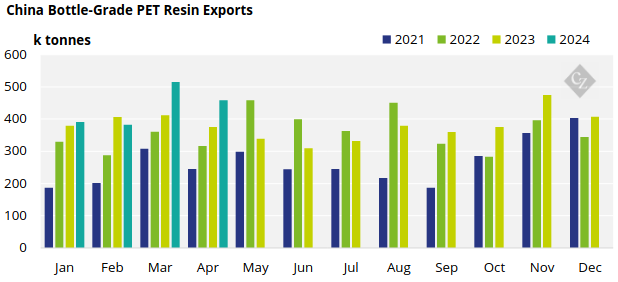
- Whilst Chinese bottle-grade PET exports (HS 39076110) fell by 11% in April to around 458k tonnes, this level was still 22% above levels a year earlier.
- Although export order intake in March and the first half of April remained strong, the ability to export in May was hit by a rapid escalation in global freight rates.
- As such, export levels are expected to have been constrained in May, a challenging situation that may bleed into the summer months.
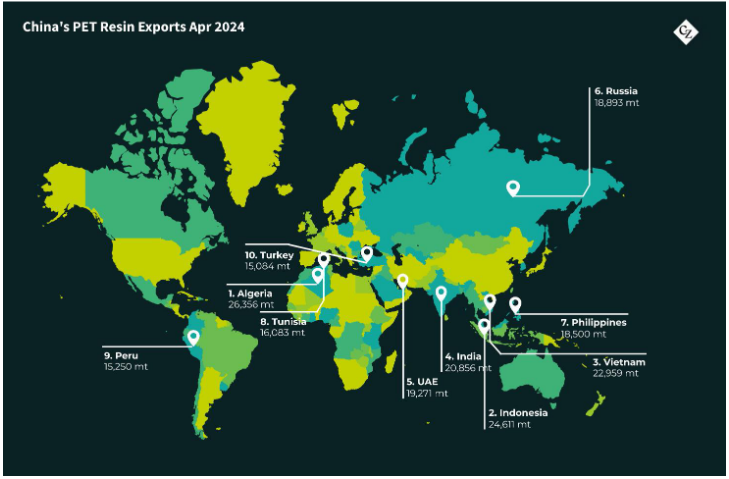
- Algeria was the largest end destination for Chinese PET resin in April, with around 26.4k tonnes, up 47% from the previous month, and up 75% from April 2023.
- Monthly exports to Indonesia and Vietnam also surged. Exports to Indonesia increased 1251% from the previous month to 24.6k tonnes. Year-on-year this represents a 348% increase.
- Whilst exports to Vietnam increased 23% on March to just under 23k tonnes (up 411% y-o-y).
EU Bottle-Grade PET Resin Market
Quarterly Imports
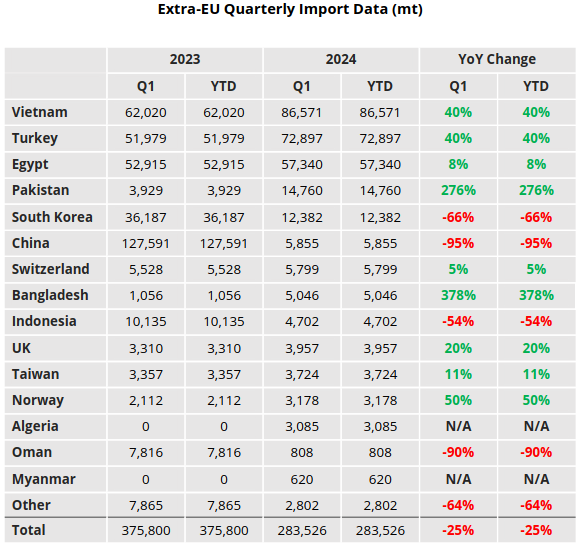
- EU-27 bottle-grade PET imports (HS Code 390761) totalled 284k tonnes in Q1’24, up 3% versus the previous quarter, yet down sharply, 25% lower than Q1’23.
- Vietnam remained the largest import origin, followed by Turkey, Egypt, and Pakistan.
- Although imports from Vietnam remained stable at around 87k tonnes for the quarter, other major origins expanded market share.
- Volume from Turkey, the 2nd largest origin in Q1’24, increased 6.8% to 73k tonnes, up 40% versus Q1’23.
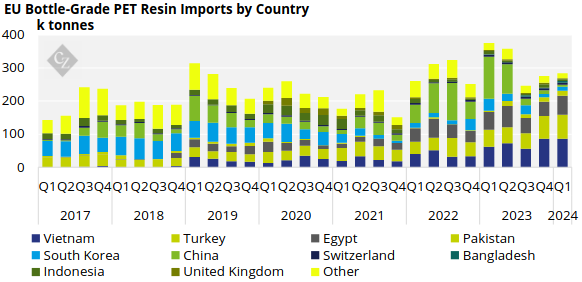
- However, the largest increases were from Egypt, Pakistan, and South Korea, up 31%, 18%, and 20% respectively.
- Volumes from Pakistan leapt from Q2 last year, following initiation of the ADD investigation against Chinese resin, current levels of around 15k tonnes are 276% up on Q1’23.
- Whereas, volume from China has all but disappeared with just 5.8k tonnes imported in Q1’24, down 95% from the same period a year earlier.
Quarterly Exports
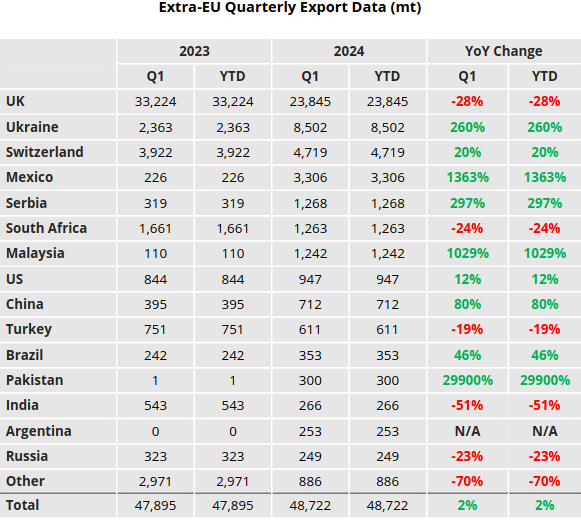
- Extra-regional EU-27 PET resin exports continued to ease slightly in Q1’24, down 5% to just under 49k tonnes, as freshly restarted lines focused on domestic sales.
- Even with that the 79% of exports out of the EU27 block remained within Europe proper, destined for the UK, Ukraine, Switzerland.
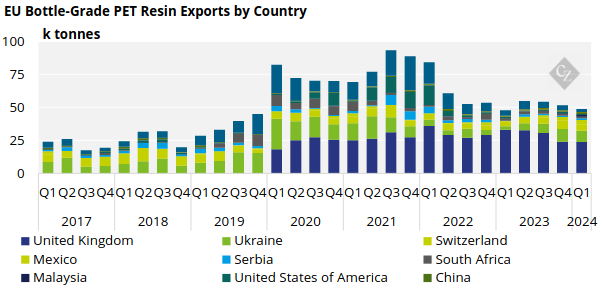
- The UK remained the largest destination for PET resin out of the EU block, with exports (under HS 390761) steady at around 24k tonnes in Q1’24.
- Although quarterly volumes to Ukraine declined by 11% to around 8.5k tonnes, volumes still show a gradual longer-term recovery trend since Q1’22.
- Although much smaller in terms of volume, exports to Mexico and Serbia grew by 13% and 51%, to 3.3k tonnes and 1.7k tonnes respectively.
US Bottle-Grade PET Resin Market
Quarterly Imports
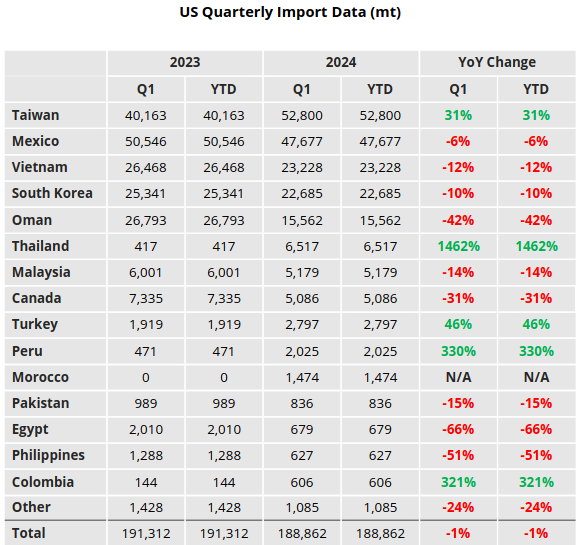
- US bottle-grade PET imports continued to slow in the first quarter of 2024, totalling 189k tonnes in Q1’24, down 6.4% on the previous quarter, although broadly on par with a year earlier.
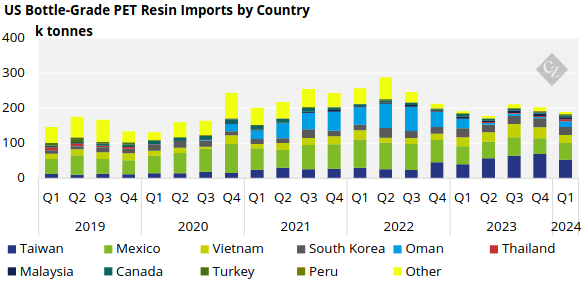
- Taiwan, Mexico, Vietnam, and South Korea ranked as the largest import origins in Q1’24. Combined these origins represented around 78% of total US PET resin imports, down from 85% previously.
- Taiwanese resin accounted for the largest share of total imports by volume, with 53k tonnes in Q1’24, increasing 8% on the previous quarter and 31% year-to-date.
- Mexico ranked as the second largest origin, although imports from Mexico into the US continued to decline, down to 47k tonnes in Q1’24, representing a 15% drop versus the previous quarter and 6% down on a year earlier.
- Imports from Vietnam also fell sharply in the first quarter, down 17% to 23k tonnes, 12% down on Q1’23.
Quarterly Exports
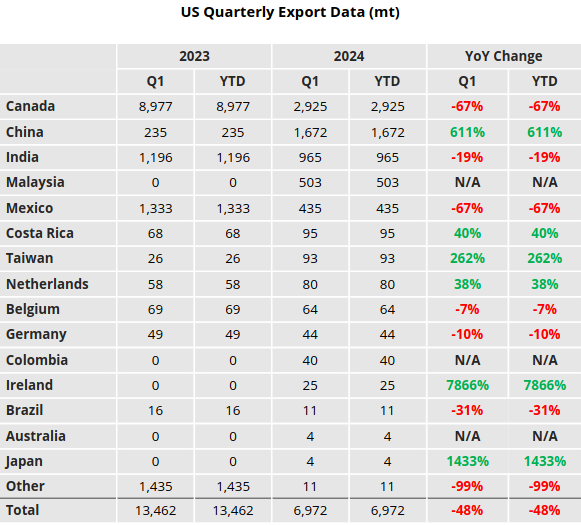
- Total US bottle-grade PET exports slumped to just under 7k tonnes in Q1’24, down a further 10% versus the previous quarter, and 45% below the Q1’23 level. A new multi-year low
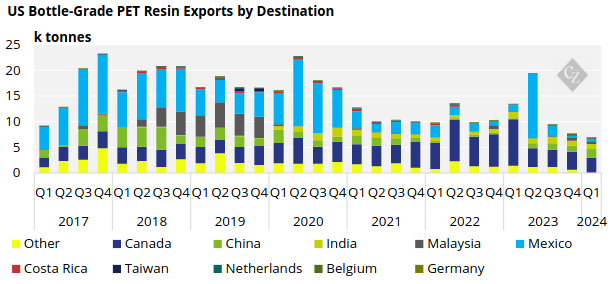
- Canada remained the largest end-destination for US PET resin exports, although Canada’s share of total exports shrank from 45% to 41% in Q1’24.
- Smaller volumes went to China, India, and Malaysia under the same HS code.
- Although increasing 7% on the previous month, exports to Mexico remained at minimal levels of just 435 tonnes in Q1’23.
Data Appendix