Insight Focus
- China PET exports continued to post record monthly highs, despite COVID-related disruption.
- EU imports leap in Q1’22, although below the infamous 2019 import wave.
- Indian exports tanked in Q1 ’22, as Chinese competition intensified.
China’s Bottle-Grade PET Resin Market
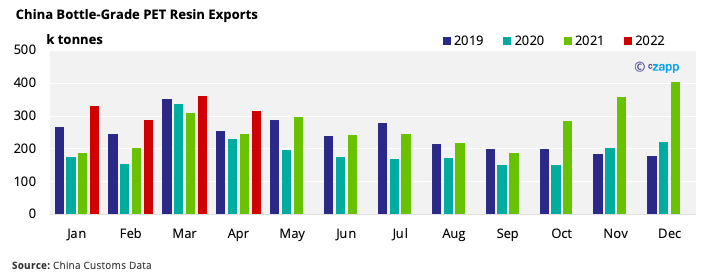
Monthly Exports
- Despite Chinese bottle-grade PET exports showing a monthly drop of around 12% to 317k tonnes in April, exports were still at multi-year highs for the month, and up over 29% on the year.
- COVID restrictions, lockdowns and environmental controls have stymied PET resin production and exports over the last month (see China’s Zero-COVID Policy Hits Domestic PET Resin Demand).
- Restrictions across China are now beginning to ease. However, the number of vessels waiting outside Shanghai and Ningbo ports remains around 11% higher than a year earlier.
- The potential for further bottlenecks on reopening is expected to result in continued delays and longer transit times over the next month.
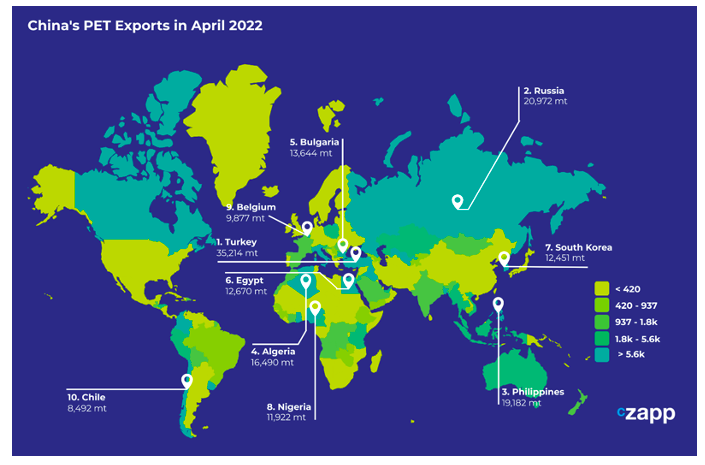
- Turkey was the largest destination for Chinese PET resin exports in April, recording over 34k tonnes, surging 99% from March, and representing just over 11% of total exports.
- Despite the Russian economy being hit hard by sanctions, PET resin flows to Russia remained relatively robust in April, increasing 8% on the month and 9% on the year.
- Chinese statistics registered zero exports to Ukraine in April.
- Huge increases to Turkey as well as other destinations, such as Bulgaria and North Africa, are because of cargoes originally intended for Ukraine being rerouted.
EU Bottle-Grade PET Resin Market
Quarterly Imports
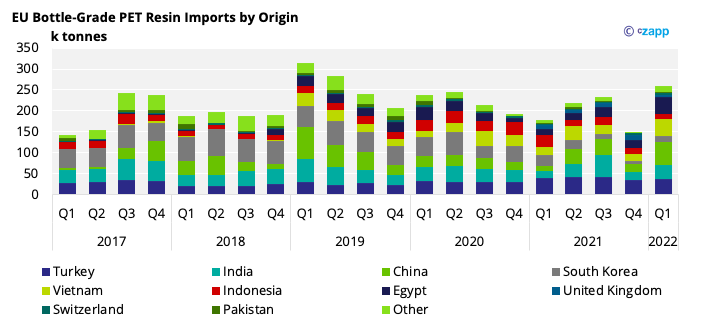
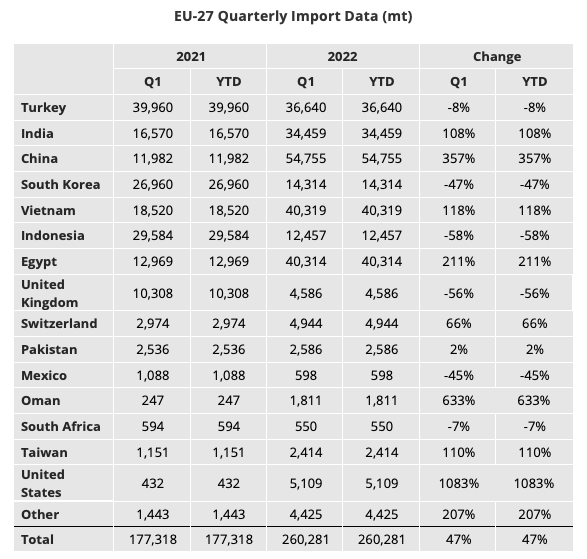
- EU-27 bottle-grade PET imports totalled 261k tonnes in Q1’22, up 73% from Q4’21 and 47% year on year.
- Top 5 sources of origin were China, Vietnam, Egypt, Turkey, and India.
- Imports from China totalled 54.8k tonnes in Q1’22, an increase of over 190% from Q4’21, representing over 21% of total EU-27 imports.
- Import volumes from Vietnam, Egypt, and South Korea all saw triple-digit % increases for thequarter as well.
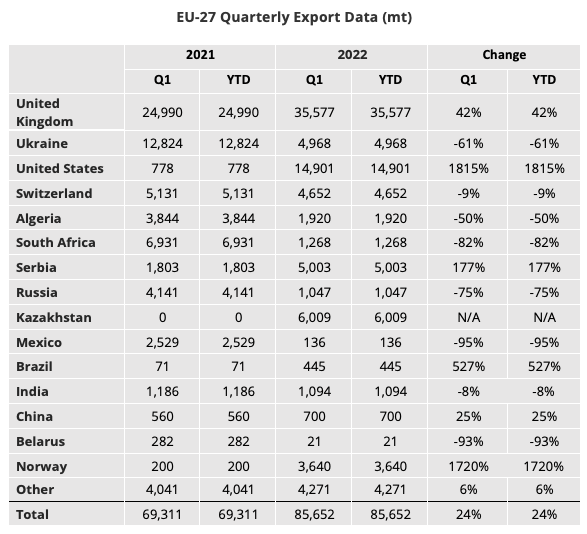
- EU-27 PET resin exports eased in Q1 ’22, down 4% on the previous quarter but still 24% higher than a year earlier.
- The UK and US remained the two largest destinations for PET resin out of the EU block, accounting for a combined 59% of total EU exports.
- Exports to the UK grew in Q1’22 to 35.6k tonnes, up 42% on the year, whilst volumes to the US stood at 14.9k tonnes, from almost zero a year earlier.
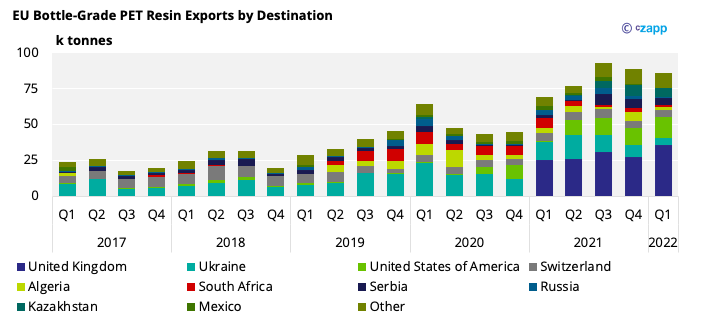
- Outside of the UK and US, there has been strong export growth from Kazakhstan and Serbia, but the volumes are modest.
- Q1’22 Exports to Kazakhstan were around 6k tonnes, Serbia around 5k tonnes.
- At least one major European PET resin producer is known to have been actively targeting the Central Asian market over the last 6 months.
- Serbiahas likely received additional, rerouted cargoes due to the war in Ukraine.
India Bottle-Grade PET Resin Market
Quarterly Imports
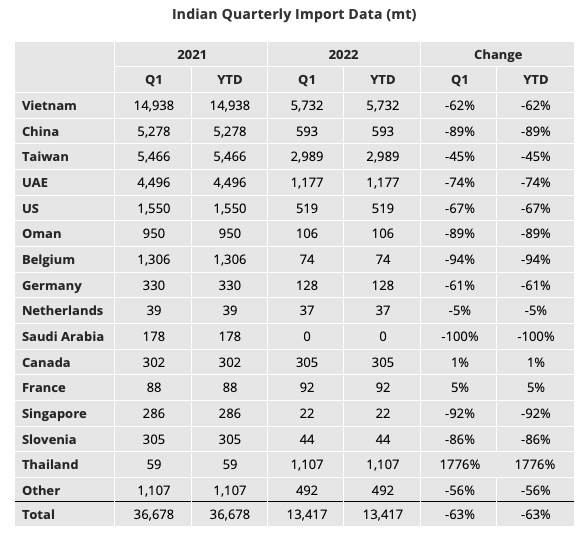
- Indian bottle-grade PET imports totalled 13.4k tonnes in Q1’22, down 35% on the previous quarter and 63% year on year.
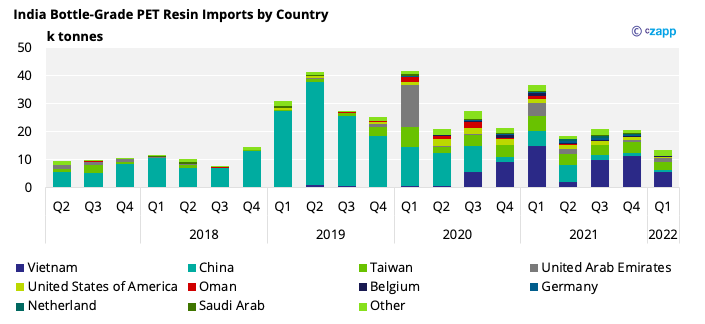
- Origins with the greatest volumes in Q1’22, include Vietnam, Taiwan, United Arab Emirates, and Thailand.
- Following the introduction of anti-dumping duties against Chinese PET resin into India in 2021, Vietnamese and Taiwanese resin has partially filled the import gap.
- Combined imports from Vietnam and Taiwan, represented 65% of total Indian PET resin imports inQ1’22.
Quarterly Exports
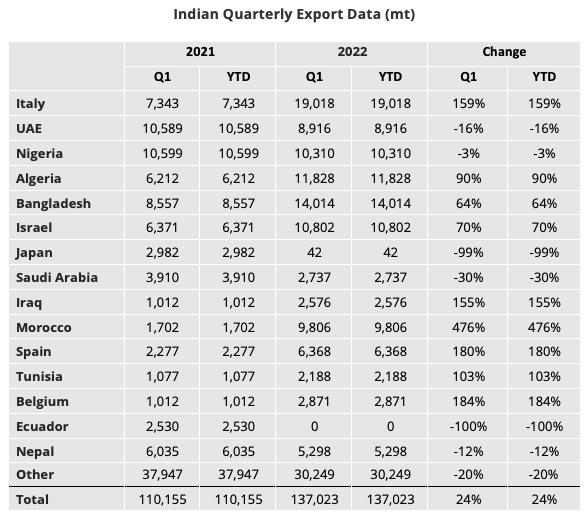
- Indian bottle-grade PET exports fell to 137k tonnes in Q1’22, down 27% on the previous quarter, but still up 24% year on year.
- Whilst exports followed a similar seasonal pattern, Q1’22 imports were down against Q1 volumes in pre-COVID years.
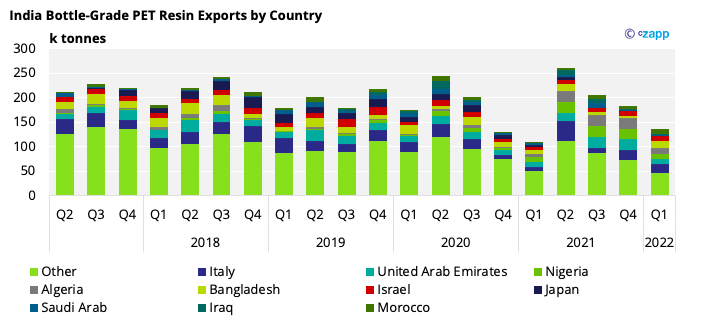
- Italy was the largest destination with over 19k tonnes in Q1 ’22, followed by Bangladesh and Algeria, with 14k tonnes and 11.8k tonnes in Q1 respectively.
- However, Indian volumes to Algeria, Nigeria, and the UAE, faced increased competition from Chinese resin, and plummeted 45-60%, on the quarter.
Data Appendix
If you have any questions, please get in touch with GLamb@czarnikow.com
Other Insights That May Be of Interest…
PET Resin Trade Flows: China’s COVID Response Slows Exports
PET Resin Trade Flows: Europe Awaits Asian Shipments