Insight Focus
- Chinese PET export volumes continue to fall, not expected to follow 2021 pattern.
- EU PET imports surge in Q3 driven by increasing volumes from China.
- US imports slow as converters look to destock ahead of year end.
China’s Bottle-Grade PET Resin Market
Monthly Exports
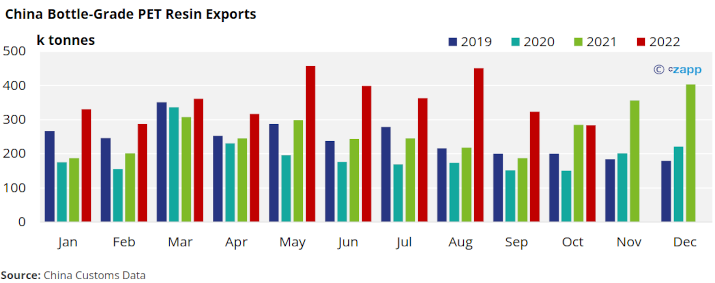
- Chinese Customs reported bottle-grade PET exports of about 283k tonnes (HS 39076110) in October, a 12% decrease on the previous month.
- Except for August’s increase, October export volumes are a continuation of the trend that has seen Chinese PET resin exports fall since May, a reversal of this trend in the remainder of Q4 is unlikely.
- However, given low PET resin prices and the collapse of container rates, demand is expected to rebound post-Chinese New Year, at the end of January 2023.
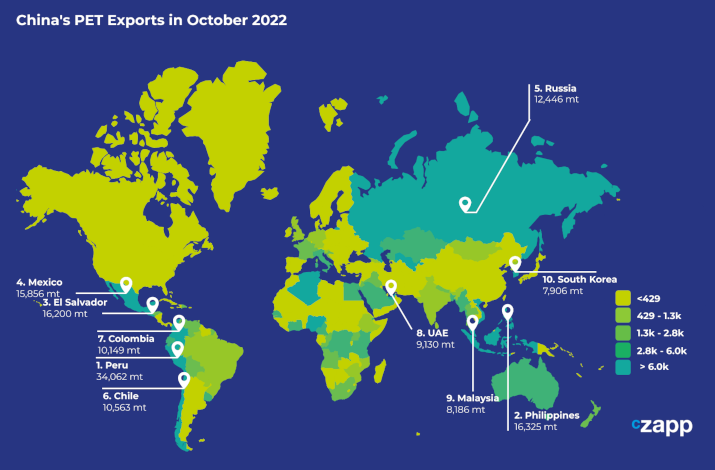
- Latin American countries occupied 5 out of the top 10 destinations for Chinese PET resin by volume in October.
- Peru was the largest destination for Chinese PET resin exports in October with around 34k tonnes, up sharply from the previous month, with 200%+ month-on-month gain.
- Volumes to Colombia, El Salvador, Chile, and Mexico also surged, with monthly increase of 256%, 132%, 84%, and 26% respectively.
- Exports to Russia remained a key destination for Chinese resin, although volumes decreased to 12.4k tonnes in October as the country moved into the quieter winter months.
- Despite the Russian economy being hit by sanctions over its invasion of Ukraine, year-to-date volumes to Russia are up 35% versus 2021.
- Notable in their absence for the top 10 list were African destinations, particularly Algeria and East African countries, such as Tanzania and Kenya. The ebb and flow of breakbulk cargoes may at least partially explain their absence.
EU Bottle-Grade PET Resin Market
Quarterly Imports
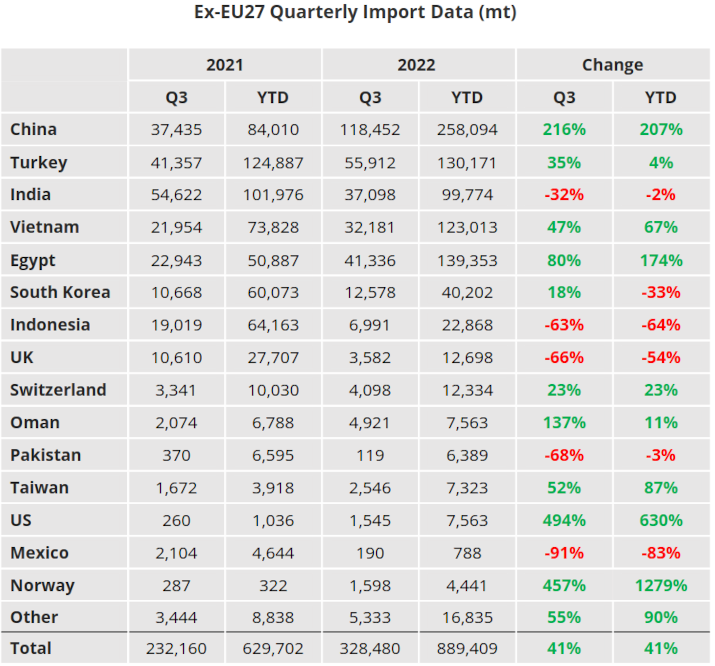
- EU-27 bottle-grade PET imports totalled 328k tonnes in Q3’22, a new record quarterly high, up 9.5% from the previous quarter and an increase of 41% year-on-year.
- Top 5 sources of origin were China, Turkey, Egypt, India, and Vietnam, equating to around 87% of total EU imports from outside of the block.
- China remained the largest source with imports increasing to 118k tonnes in Q3’22, representing over 36% of total EU-27 imports in the quarter, and increasing of 39.5% from Q2’22.
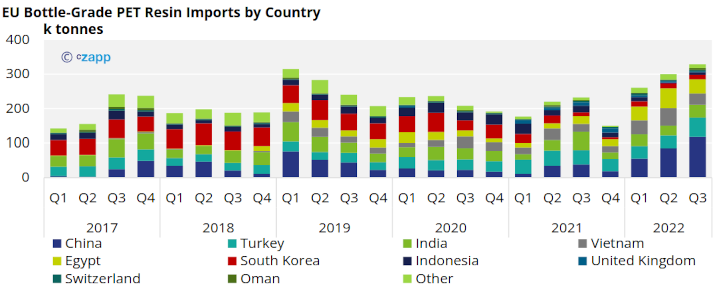
- Imports from Egypt and Vietnam slackened in Q3’22, down 28% and 36% respectively, having previously seen the largest increases through the first half of this year.
- Although smaller in volume, imports from Indonesia and Oman, saw quarterly gains of 104% and 492% respectively.
Quarterly Exports
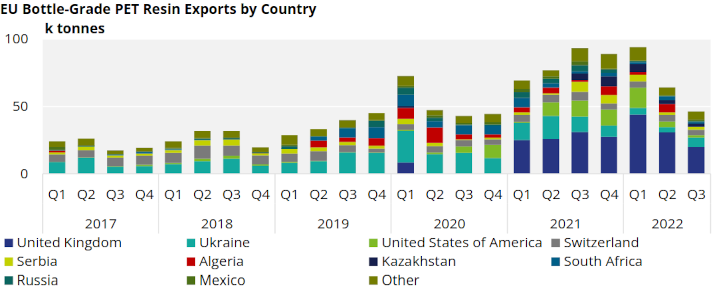
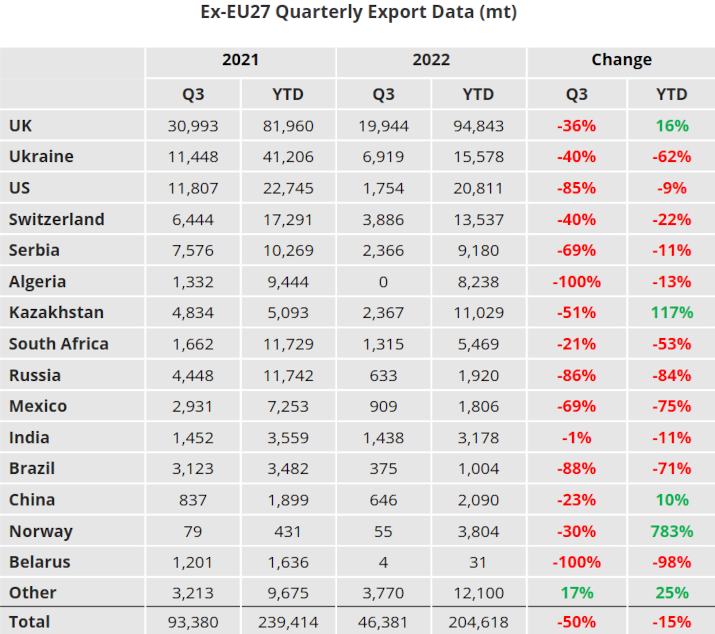
- Extra-regional EU-27 PET resin exports (HS Code 390761) continued to decline in Q3, down 28% versus the previous quarter to around 46k tonne.
- The UK remained the largest destinations for PET resin out of the EU block, followed by smaller volumes to Ukraine, Switzerland, and Kazakhstan.
- Quarterly exports to the UK fell by 35% to 19.9k tonnes, whilst volumes to Ukraine showed a strong recovery, increasing 89% to 6.9k tonnes.
US Bottle-Grade PET Resin Market
Quarterly Imports
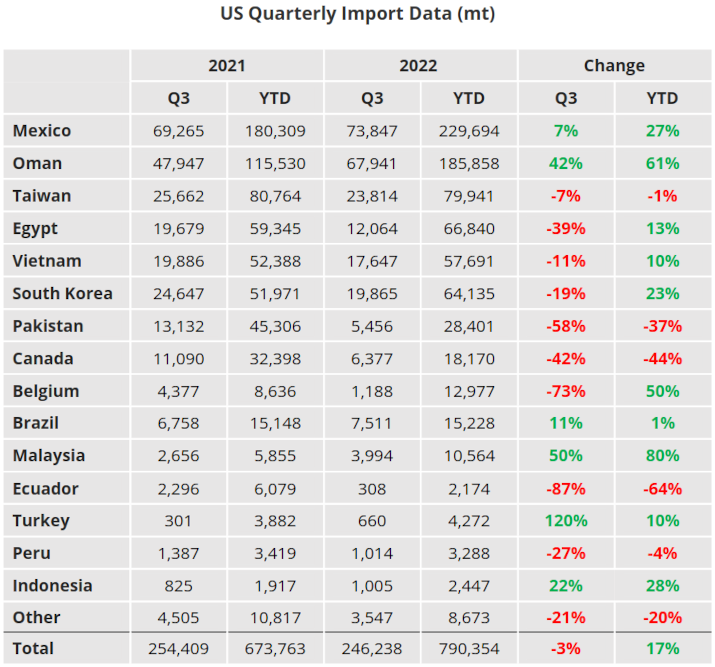
- US bottle-grade PET imports totalled 246k tonnes in Q3’22, down 14% on the previous quarter and a little over 3% year-on-year.
- With warehouses full and hurricane season in the rear view, converters have been destocking ahead of year end. Slower demand, and ample availability, is likely to see import volumes reduce further in Q4’22.
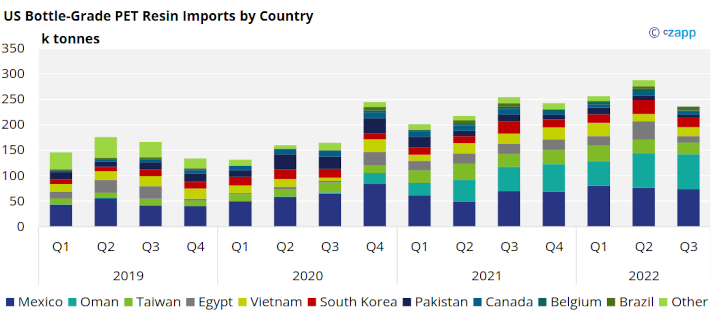
- Origins with the greatest volumes in Q3’22, include Mexico, Oman, Taiwan, and Egypt.
- Volumes from Mexico and Oman dipped slighting in Q3, down 2.7% and 1.3% respectively.
- Since Alpek’s acquisition of the Omani PET resin producer OCTAL, volumes from Oman have increased, up 61% year-to-date.
- Volumes from other origins, including Canada, Pakistan, and Taiwan have lost market share, with import levels in the first 9-months of 2022 below that of the previous year.
Quarterly Exports
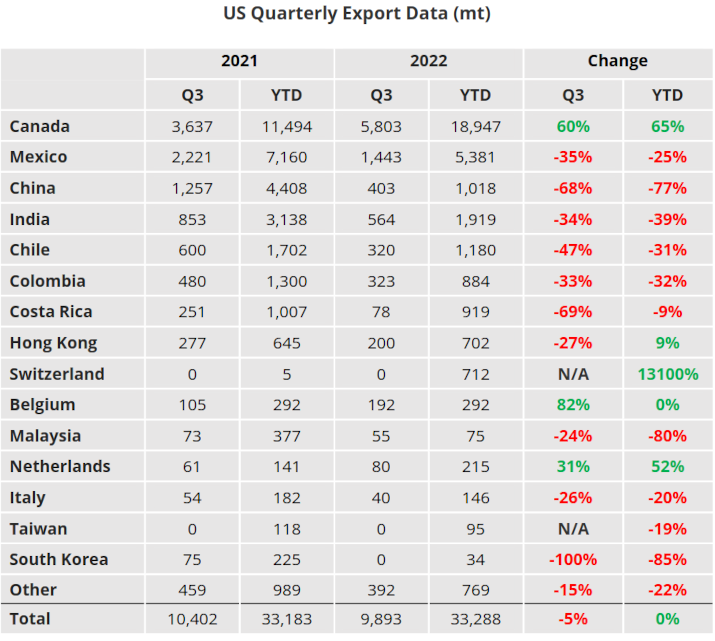
- US bottle-grade PET exports totalled just 9.9k tonnes in Q3’22, down 27% on the previous quarter and 5% year-on-year.
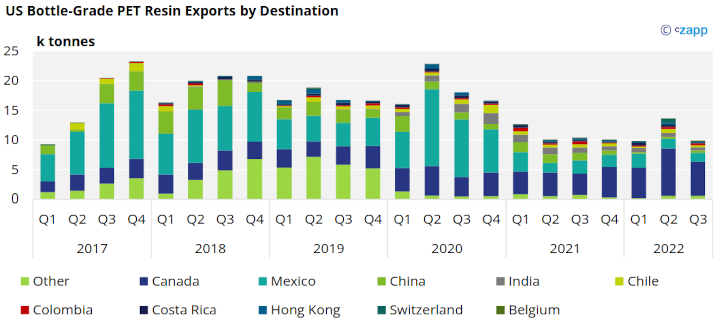
- As is traditional, over 73% of the total export volume in Q3’22 remained within North America, with Canada the largest destination.
- Around 5.8k tonnes was exported to Canada in Q3’22, accounting for the bulk of the increase, down 28% versus the previous quarter. A further 1.4k tonnes went to Mexico.
- Despite fears of a global recession US resin demand at the consumer level is expected to remain firm, as such exports are expected to remain subdued into 2023.
Data Appendix
If you have any questions, please get in touch with GLamb@czarnikow.com.
Other Insights That May Be of Interest…
European PET Market View: European PET Producers Face Difficult Q1 as Import Delta Widens
Plastics and Sustainability Trends in October 2022
