Insight Focus
Soybean oil shows signs of a bull market. Three of five key conditions are currently met, including a supply-demand imbalance. A cleared delivery window and stronger demand signals are needed.
Biofuel Talks Boost Soybean Oil Outlook
Let’s turn to the hot topic of the day for the US soybean processing industry, which primarily manufactures high quality vegetable protein meal (roughly 80% of our volumetric production). Vegetable protein meal is a key ingredient globally for animal nutritionists designing effective and beneficial feeds, and secondarily produces high quality vegetable oil (roughly 20% of our volumetric production) for food and industrial purposes.
Rumours swirled at the end of last week that the US fuel industry—call it big energy—and the US biofuel and biofuel feedstock producing industry—call it big agriculture—had struck a grand bargain to finalise volume commitments for the blending of ethanol, biodiesel and renewable diesel into petroleum-based fuels to produce finished gasoline and diesel for domestic consumption and regulatory compliance.
The question for the US soybean processing industry emerges as to whether this new commitment, if it comes to fruition, could return biofuel feedstock markets—primarily soybean oil—back into the go-go bull markets of 2021–2022, with demand outstripping supply to the extent that flat prices and the forward curve would need to cool demand via a sharp rally and a steep inversion, respectively.
That was then…the go-go 2021–2022 vegetable oil bull market led by US soybean oil.
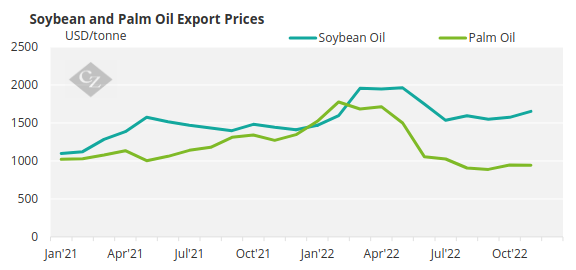
Source: World Bank
This is now… with US soybean oil the cheapest in the world (USD 1,000/tonne cheaper than the 2022 peak).
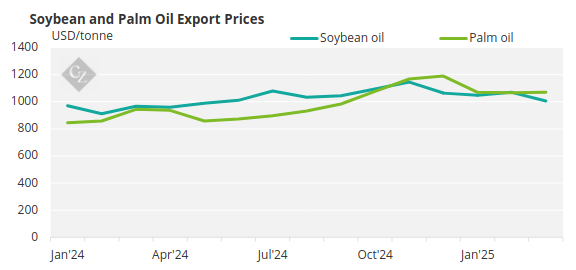
Source: World Bank
Soybean Oil Hits First Bull Market Benchmark
Let’s review the five characteristics of a classic, sustainable bull market for an agricultural commodity.
- First and foremost, a bull market must feature a fundamental imbalance between supply and demand, with demand exceeding supply, as detailed by USDA economists in their various reports. As an American, I rely on the USDA information system to provide key production and demand data, as well as economists’ analysis of that data. In my humble and American-centric opinion, there is no other data source as comprehensive and also available at no charge. It is also my opinion that no other public or private agency shapes the global market’s perception of supply and demand for agricultural commodities more than the USDA. As traders and risk managers, we remain in the business of navigating the market’s perception of supply and demand—not the reality of true supply and demand.
- Second, and importantly, the bull market must be supported by economists issuing regular and sequential “bullish” updates to key metrics underlying the supply and demand imbalance. The conclusion from analysis of these metrics must be that supply is insufficient to meet demand, and that demand must be slowed via higher prices. In trader parlance, the colloquialism “the bull must be fed every day” captures the concept.
- Third, the bull market should feature a forward curve that exhibits spot prices higher than deferred prices—i.e., an inverted price curve that promotes consumers deferring consumption to a later date to enjoy lower prices in the future. In other words: “Hey, look, if I wait three months to buy, I can get a 5% discount to today’s prices.” An exception to this would be a curve that is flattening or on the verge of inverting.
- Fourth, if there is a futures market for the grain or oilseed, and the futures contract features physical delivery as opposed to cash settlement (such as the CME Soybean Oil contract versus the CME’s Palm Oil contract), the delivery window of available supply should be empty—or nearly empty and headed toward empty.
- Fifth, and finally, the grain or oilseed market in question needs to exhibit some relative strength in its price action. For me, a fundamentalist and someone who uses discretion for trading and risk management, prices for a given agricultural commodity remaining above a shorter-term moving average (for instance, the 25-day simple moving average) suffices.
Still with me? Let’s now review the soybean oil market in light of the five characteristics of a bull market.
Demand Exceeds Supply
One of the key outcomes when demand exceeds supply is a reduction in inventories, due to the inability of everyday production to keep up with demand. While USDA economist forecasts may indicate that demand is outpacing supply, there’s no better confirmation than seeing those same economists lower inventory estimates—especially inventory relative to demand.
In the grain and oilseed trade, we call this relationship between available inventory and demand the stocks-to-use, stocks-to-usage, or ending stocks-to-use ratio.
See the USDA’s March 20 supply and demand table for soybean oil, with the calculated stocks-to-usage ratio column highlighted in blue:
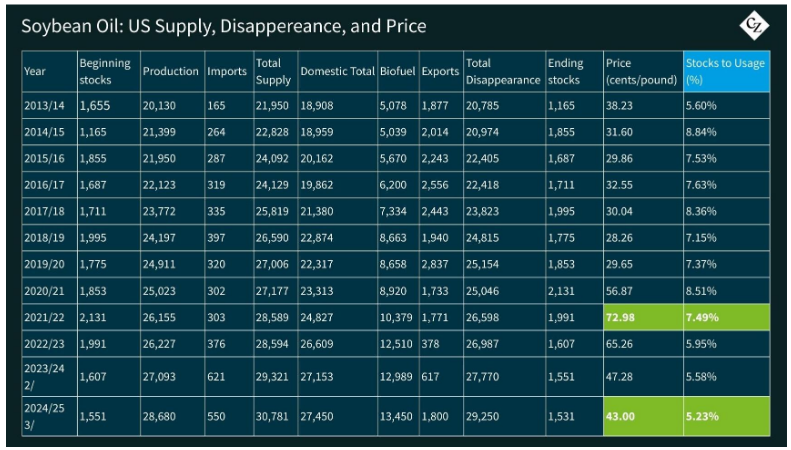
During the period covered by the data, US soybean oil production continues to trend higher—but so does disappearance, driven primarily by growing demand from the biofuel sector. At the same time, ending stocks continue to trend lower, along with the stocks-to-usage ratio.
Requirement #1 for a bull market: check—requirement met. USDA economists continue to confirm that demand is exceeding supply.
Supply is Insufficient to Meet Demand
Now, what about the bull getting fed every day—is it happening? For soybean products (both soybean meal and soybean oil), the USDA’s marketing year begins on October 1 and ends on September 30 of the following year. So, has the USDA been regularly feeding the bull this marketing year with its forecasts?
The table below details US soybean oil total use and ending stocks projections by USDA economists since the beginning of the marketing year, as published in the monthly USDA report Oilseeds: World Markets and Trade.
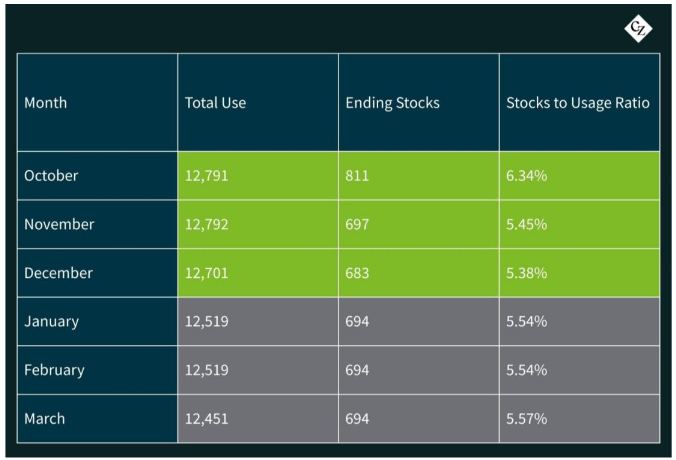
Values in million tonnes
I highlighted the “feed the bull” data in green, with sequential reductions in ending stocks forecasts that lead to tighter stocks-to-usage ratios. I highlighted the “not feeding the bull” data in grey, which reflect periods of lower usage and slightly higher ending stocks forecasts. These reversals broke the sequential tightening trend and ultimately resulted in a higher stocks-to-usage ratio.
This shift in momentum toward looser ending stocks coincided with the transition from the Biden to Trump Administrations and the ensuing collapse in biofuel production. The sharp drop in soybean oil demand as a biofuel feedstock was driven by policy uncertainty faced by refiners.
In conclusion, the second characteristic of a bull market does not currently apply to US soybean oil—the bull market is not being fed sequential bullish information. But could that change very soon? Industry representatives, regulators, and the Trump Administration are in the process of finalizing biofuel policy, and if that leads USDA economists to begin raising total use forecasts again in the coming months, we could see the return of the downward trend in stocks-to-usage.
For now, however, the bull market is missing a key component: being fed every day. (Yes, I know—some professionals are probably rolling their eyes and thinking, “Does this guy even watch US export sales reports on Thursdays?”)
And what about the third characteristic—the inverted price curve? Where does that stand in the context of a potential bull market?
Below is the closing full soybean oil futures curve for April 4, 2025, courtesy of the CME’s Daily Bulletin:
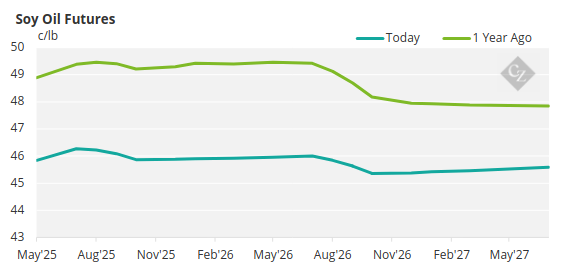
A significant carry has formed in the front part of the curve, the relationship between the May soybean oil futures contract at 45.84c/lb, remaining lower than the next futures contract month, the July contract at 46.27c/lb. From the July contract forward, however, the market remains slightly inverted and flat-ish around 46c/lb.
This structure shows a classic curve shift—moving from a carrying charge structure that promotes demand to an inverted structure that discourages it. For my purposes, while it’s not a textbook fully inverted curve (with every futures contract priced below the spot month), it gets the job done.
Requirement for an inverted (or on-its-way-to-inverting) futures curve: check.
The Delivery Window of Available Supply Should Be Empty
The fourth requirement—a delivery window that is empty or emptying—does not support the bull case. According to the CME’s daily registrar report, there are 1,455 receipts (each representing 60,000 lbs of soybean oil) sitting in the delivery window—and no one wants them. Why? Because they’re expensive relative to the physical market.
In other words, the futures market is trading at a premium to cash. These receipts are just sitting there, weighing down the front of the curve like a millstone, keeping the front-month futures contract in a carry relative to the rest of the curve—exactly as the current soybean oil futures curve shows.
And what about the fifth characteristic of a bull market—relative strength in soybean oil prices, as represented by the CME’s soybean oil futures contract? Have prices remained above their 25-day simple moving average? That one’s easy (especially after Mr. Trump’s tariff revision last week). The answer is yes!
WASDE supply and demand adjustments for global vegetable oils could feed the bull, an EPA announcement on biofuel policy could feed the bull, or a Trump announcement on anything could feed the bull.
But the biggest change needed to make the soybean oil bulls run? Physical soybean oil markets in the US trading above futures values (leading to consumers clearing the delivery window of available supply).
When and if that happens, especially if new biofuel policy is constructive for soybean oil demand and longer term in nature, the price of soybean oil and the forward curve will likely look a lot like it is 2021-22 all over again.
For the here and now, feeding the bull daily is weak and the overhang of supply in the delivery window ismtroublesome for a full inversion of the forward curve. However, three of the five characteristics for a bull market are present. The key component is the imbalance between available supply and current demand, which supports the bull thesis.
When will the soybean oil bulls run? When the physical market makes the final push.