Insight Focus
- Record collapse in Argentine soybean production.
- Record Brazilian soybean production ahead.
- Record ending stocks of soybeans in China.
Tuesday last week featured the USDA memorializing (finally) several world records in the oilseed supply and demand arena. The USDA’s World Agriculture Supply and Demand Estimates’ (WASDE) records included:
- A blowout record Brazilian soybean production
- An epic record collapse in Argentine soybean production
- Highest ever percent usage of imports for Argentine soybean crush
- Record ending stocks of soybeans in China
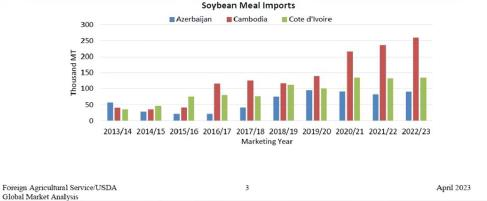
- Record Cambodian soybean meal imports (huh?…more on that later)
I write “finally” above because the USDA publishes the WASDE only monthly and significant crop development (or decline in the case of Argentina this year) occurs during those 30 days that private forecasters update real time. The private forecasters have a full month lead on the USDA and the grain and oilseed markets tend to move quickly to reflect private forecasts BUT always delay the final price movement waiting for USDA confirmation (or disagreement with) of the private forecasters. At the end of the day the USDA has the final say as the USDA fixes the reality of crop and livestock production and demand in the collective markets’ mind and as successful traders know, forget using actual supply and demand as your guiding light, use USDA statistics to trade.

The above chart details a couple of things, primarily that the record 154 million metric tons of Brazilian production came about primarily from a good yield but not a RECORD yield; in other words, without acreage expansion, the record production would not have occurred. On the positive side for future production the chart also displays an obvious yield step function from a 2010-2015 average of about 2.85 metric tons per hectare UP to about 3.5 metric tons per hectare or about a 22% step UP in productivity per hectare. The question for the global consumer is whether the blue line (yield) can continue to step UP because otherwise it is the green bar (area) that needs to do the work. And when we talk about global consumers we primarily mean China and no one understands that better than this guy:
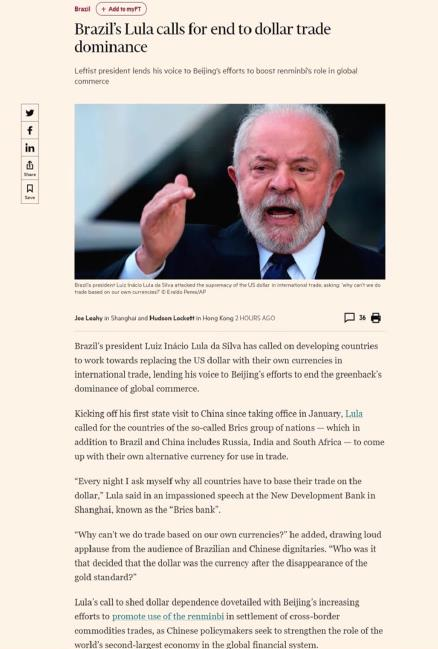
I wonder if the Chinese will buy more or a lot more soybeans when they pay for them in Yuan? Hmmm.
Per prior posts, the USDA’s man on the scene in Argentina initially forecasted this year’s Argentine soybean production at 51 million metric tons (MMT). The USDA’s Washington, DC based economists who put together the WASDE now call the crop 27 MMT (the privates are generally maintaining a 25 MMT forecast). That’s a record crop collapse that has many implications. See highlights below.


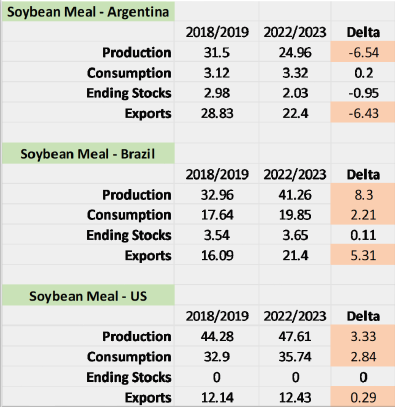
Source USDA Oilseeds: World Markets and Trade April 2023
The above data table snapshots the global picture for total protein meals (soy, sun, canola/rapeseed, peanut, cottonseed, fish, coconut, palm kernel) and details for soybean meal over the last 5 years. Notice that soy provides 2/3rds of the world’s protein meals so it is the overwhelming “go to” protein meal for feeding animals and fish globally. Also notice, highlighted in red, a very disturbing statistic: consumption surpassing production, a not (very) sustainable trend. And notice forecasts for tighter stocks (in yellow).
Source USDA Oilseeds: World Markets and Trade April 2023
Look at the above tables you analysts in the “coming mountain of US soybean meal” faction.
Argentina is a downward production spiral leading to a downward export spiral; Brazil is on an upward production spiral leading to an upward export spiral BUT, unlike Argentina, domestic consumption is growing too and demand looks more like the US’s, i.e. production of soybean meal grows but so does domestic consumption leaving limited room for exports. While the Brazilian exporters have been able to fill in for the Argentines in part, they have not been able to complete the job and the decline of 1.1 million metric tons of those two countries combined exports leaves an opening for the US (mountain).
So besides tightening the global protein meal balance sheet how else do USDA economists solve the nearby supply/demand imbalance? They forecast Argentina will import a record tonnage of mostly Brazilian soybeans relative to annual crush to meet the world’s needs. Fully 25.94% of Argentine crush will happen because of the willingness of Brazilian merchants to sell Argentine crushers soybeans that Argentine farmers will not (they intend to hold 18.1 million tons off the market per the below table).

Why? Ummm…they don’t like the terms the government is offering.
That’s okay, the Argentines can just import more soybeans from Brazil because Brazil’s largest customer does not mind (even though they may need every soybean that Brazil can provide get past the US Navy’s Brazilian ports blockade in the not-too-distant future to build record in country stocks). Kidding about the not minding. They really do mind. And those nails below hurt.

BUT, these guys (red line below) are helping solve the global protein meal crisis problem, really, they are.

[Aside: if your career choice has you working in the renewable diesel and biodiesel industries and you are not following Scott Irwin’s FREE series on the US’s biomass-based diesel revolution you are really missing something. https://farmdocdaily.illinois.edu/category/areas/other/renewable-diesel-boom The above chart belongs to Scott and team at the University of Illinois’s FarmDoc].
While they (red line above) think they are financing and promoting US domestic soybean crush for soybean oil for RD production, they are in fact helping secure global soybean meal supplies for non-China rest of world because these two (below charts) trends are not (very) sustainable: global soybean imports increasing for China (who uses the meal domestically and does not reexport any meal tons) while the rest of the world gets less soybean meal due to Argentine issues.


I love it when the USDA does small country call outs like this one above that displays 3 ‘s usage that is too small to get detailed in the global demand tables and end up combined in USDA’s “Other” category, always, by far, the largest source of demand for protein meals. Cambodia is a few short years away from making it into the detailed countries list given her current growth trajectory. While the tonnage is small today the percent change is HUGE and that is the unfolding story of global protein meal demand.
One other quick aside. If you had told me a year ago that the cheapest source of vegetable oil in the world would stem from Ukraine I would have asked you when you had recently stopped by the dispensary in Colorado. I will save commentary on this for another time.

