
Every effort has been made to ensure accuracy but no guarantee is offered by Technical Commentary or Mike Ellis against errors or omissions and no liability will be accepted for any trading undertaken based on the analysis or suggestions provided herein. This information is intended solely for the personal and confidential use of the reader and may not be redistributed, retransmitted or disclosed, in whole or in part, or in any form or manner, without the written consent of Mike Ellis as principal of TechCom. Copyright © 2022 Technical Commentary
Featuring 8 key futures markets that combined add up to more than 50% of the entire weighting of the Bloomberg Commodity Index (23 markets total) and augmented by analysis of the Bloomberg Index and the US Dollar Index, this report offers the preeminent heavyweight commodity sector portfolio.
For more information please contact Michael here.
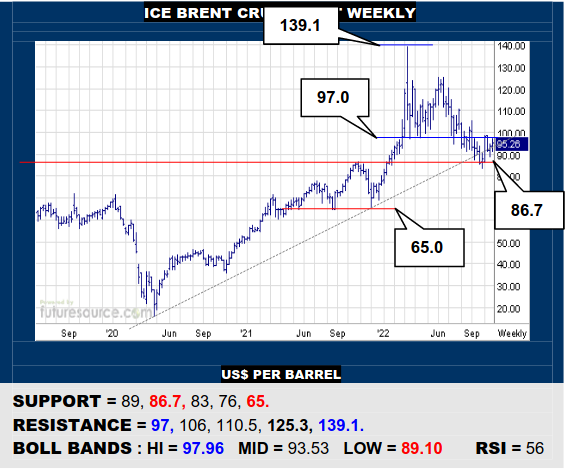
ICE BRENT CRUDE OIL SPOT WEEKLY
A chart not unlike that of the B-Berg, Brent has been buffered by its big monthly base under 86.7 but must translate this into a rebound clear of the 97 border of the ’22 top to signal turning the corner and having a fresh shot up to the 120’s. Alas, a second refusal at 97 would instead keep 86.7 exposed, a deeper gouge to 65 threatening below.
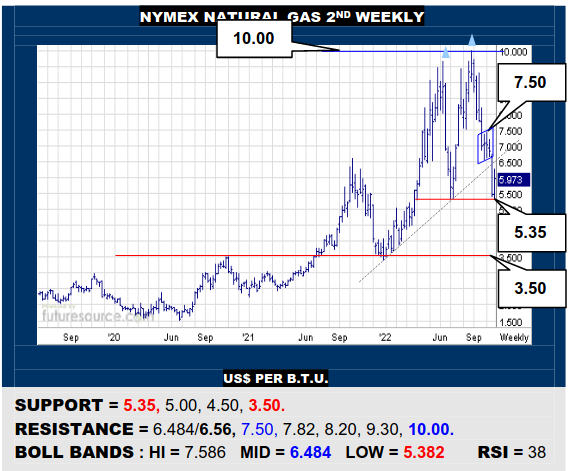
NYMEX NATURAL GAS 2ND WEEKLY
A crucial save at the 5.35 midyear trough but Nat Gas must build this into a reflex over 6.56 to pop its mid band and the former weekly bear flag. Success would mark a significant recovery to access 7.50 but if the bounce came up shy of 6.56, keep minding 5.35 closely as tipping over it would form a major double top aimed down to at least 3.50.
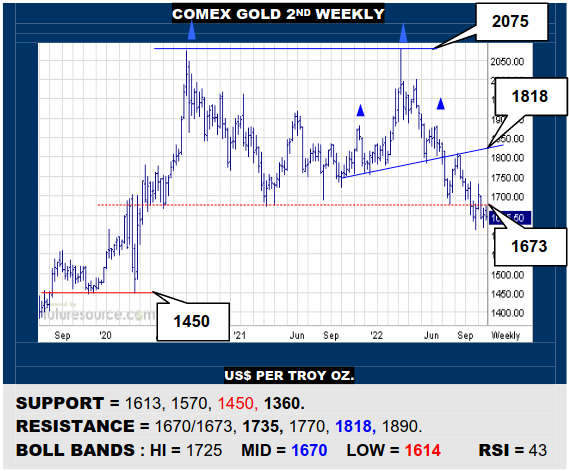
COMEX GOLD 2ND WEEKLY
The weekly chart vividly emphasizes the massive ‘20’s double top in Gold and treading water beneath 1673 does nothing to dispute it, thus currently inferring risk way on down to 1360. Only reemerging across the 1670’s would mitigate recent damage and present a shot at 1735, the trigger for a better rebound to contest a H&S neckline at 1818.
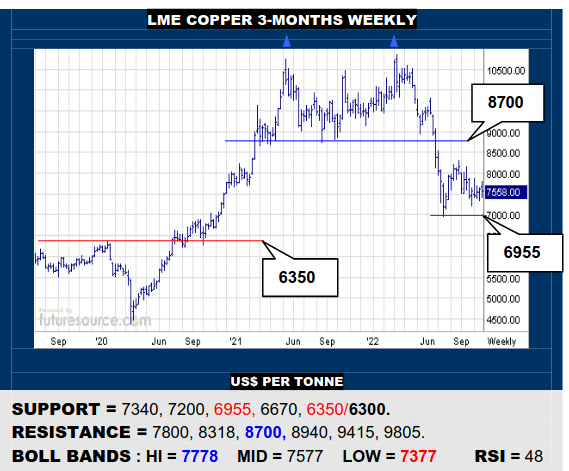
LME COPPER 3-MONTHS WEEKLY
Copper has made noises of an inverse H&S trying to form but needs the Dollar uptrend to snap to shore up that pattern and thereby open the path to challenge the big double top rim at 8700. Not a solid grip in the meantime and loss of 7200 would instead suggest a missed opportunity and threat of breaking 6955 to continue south to the 6300’s.
CBOT SOYBEANS 2ND WEEKLY
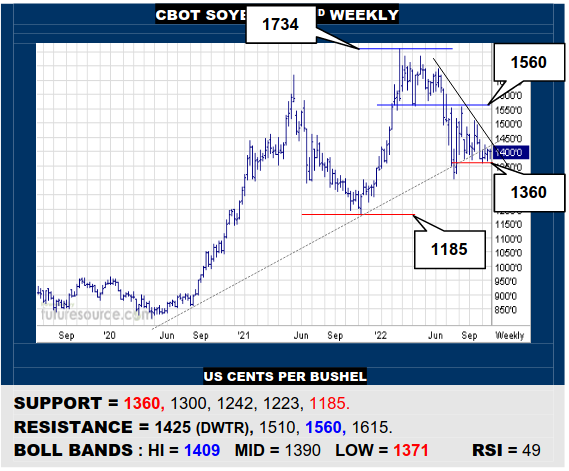
The weekly scene of Beans shows the broad ‘20’s uptrend has broken but the 1360 shelf is currently tempering the impact of that. Make no mistake, if it later gave way, the result could then be a sharp drop to the 1185 trough. Still fighting meantime though and watching the interim downtrend (1425) as an escape hatch back up to test 1560 instead.
CBOT CORN 2ND WEEKLY
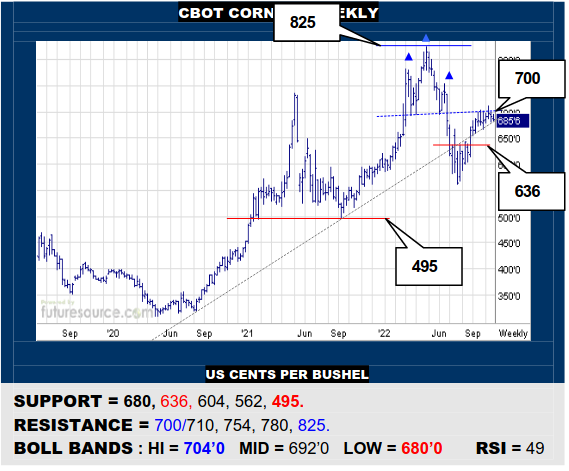
Corn’s first half ’22 H&S has been blunting the second half recovery effort and a key nearby ledge at 680 has emerged. If the market tipped off this, the H&S refusal would be reiterated and pressing on through 636 would prove a broader uptrend derailment, pointing as deep as 495. Must punch through 700/710 to otherwise generate new drive.
NY SUGAR #11 SPOT WEEKLY
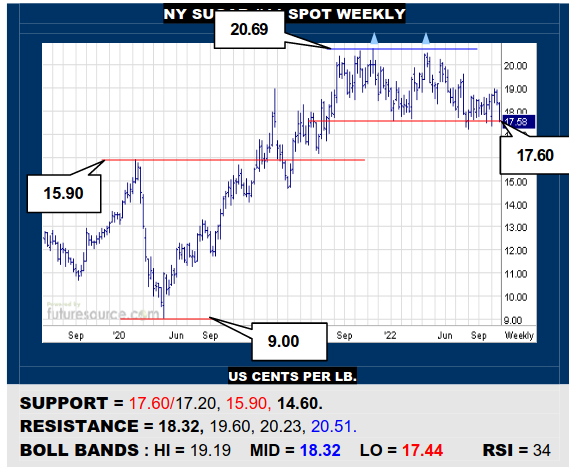
Sugar has fallen back from an 18.80’s Mch H&S border to resume its scrutiny of the 17.60-17.20 Q3 buffering. If finally breaking through here, it would bring resolution to a year-long double top and warn of steps down to 15.90 and later 14.60. Must alternatively cling to the mid 17’s and react over the mid band (18.32) to dodge the bullet once more.
NY COFFEE 2ND WEEKLY
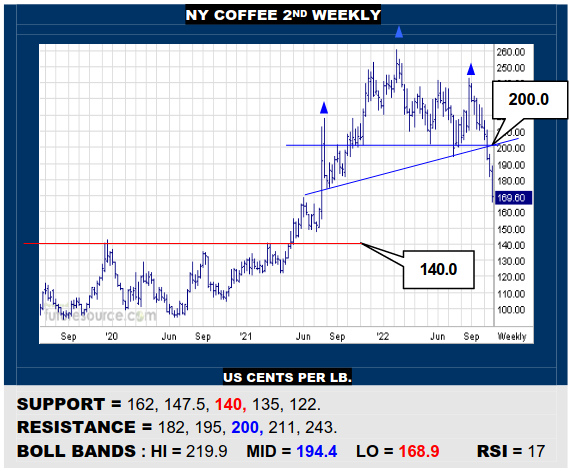
The Q3 daily H&S top caused a dive out of the 200’s in Coffee that has gone on to create a vastly bigger weekly H&S here. Indicators are fully in sync with the decline and support is now sparse until the much better sub-140 previous base. Beware heading on down there then before the decline could get truly oversold and thus in need of a corrective breath.
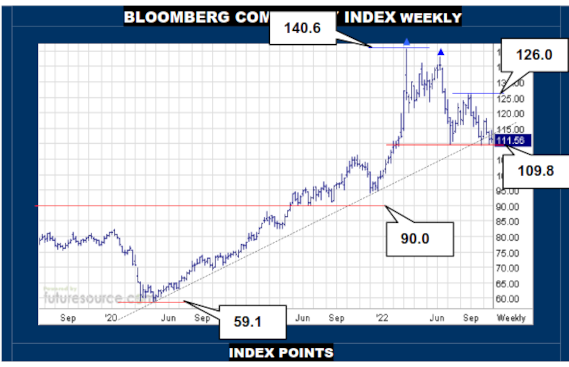
BLOOMBERG COMMODITY INDEX WEEKLY
The Dollar hanging on aboard its ’22 uptrend midweek allowed the B-Berg only a brief glimpse over the mid band before it has slipped back Friday. This still leaves a perilous situation on the weekly chart as it is apparent the ‘20’s uptrend is fraying and putting ever more responsibility on 109.8 to keep the scaffold intact as it also marks a lesser 38.2% Fib retracement of the prior 2-year advance. Commodities must hold tight here then or else a clearer cut trend break would open the door on down to the 90 area, a full 61.8% retracement. Badly needing the Dollar toppled from its trend instead and Brent to punch through its $97 top frontier to bolster chances to bounce back.

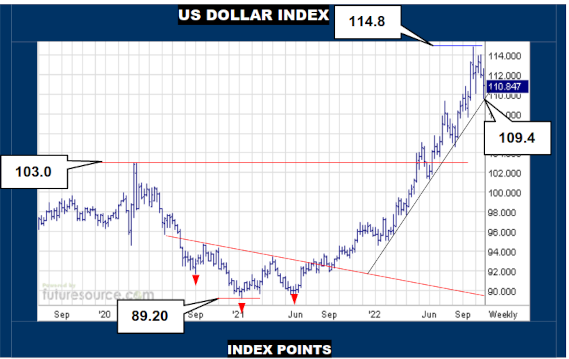
US DOLLAR INDEX WEEKLY
Oddly, the weekly chart offers a good compromise between the two daily chart uptrends for the Dollar, placing the trend here at 109.4 currently. This doesn’t yet diffuse the toppy landscape of the past two months but does insist a blatant ousting from the 110’s feature to hail a breakdown of the big ’22 climb and create exposure back to 103 while giving a corresponding opportunity for commodities to pull off that vital catch at 109.8. If instead the Dollar could shore up in the 110’s to preserve its uptrend and later steer back over 111.8, it might still come through what would be its biggest correction since leaving the 89’s and yet have a shot at the 121 millennium high.

Every effort has been made to ensure accuracy but no guarantee is offered by Technical Commentary or Mike Ellis against errors or omissions and no liability will be accepted for any trading undertaken based on the analysis or suggestions provided herein. This information is intended solely for the personal and confidential use of the reader and may not be redistributed, retransmitted or disclosed, in whole or in part, or in any form or manner, without the written consent of Mike Ellis as principal of TechCom. Copyright © 2022 Technical Commentary


