Insight Focus
Chinese PET resin exports continue strongly at 500,000 tonnes. This has been boosted by new capacity. EU PET resin imports surged in Q2, as imports from Vietnam dominated the market. US exports show signs of recovery in Q2, supporting temporary Mexican market tightness.
China’s Bottle-Grade PET Resin Market
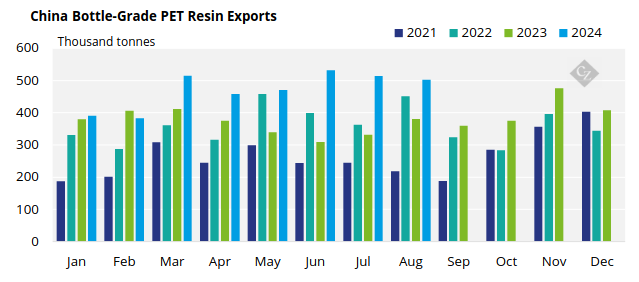
Chinese bottle-grade PET exports (HS 39076110) in August were 503,000 tonnes in August. Although volumes fell 2% month-on-month this marked the third successive month with export volumes more than 500,000 tonnes.
August also saw continued strong new order intake. As a result, September export levels are expected to be just under the 500,000-tonne level. Beyond this, continually declining freight rates has seen buyers take a wait-and-see approach, which may lessen late September/early October shipments.
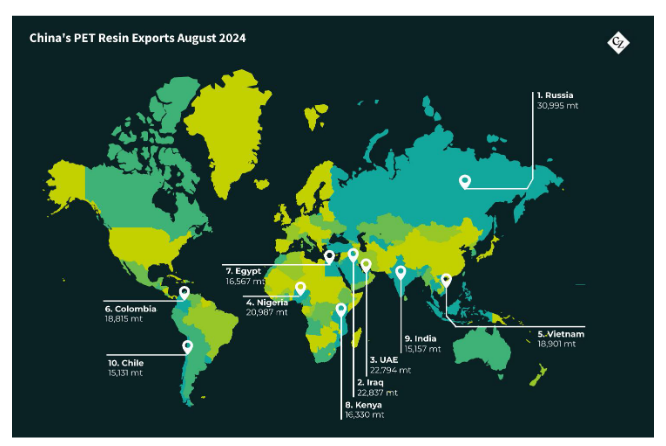
Russia remains the largest end destination for Chinese PET resin in August, with around 31,000 tonnes, up 58% from the previous month, and up 169% on the same period a year earlier. The Middle East also received for significant volumes, with Iraq and the UAE ranking second and third in August, both with just under 23,000 tonnes.
Resin exports to West Africa remained strong, with around 21,000 tonnes exported to Nigeria, up 142% from July and over double year-on-year.
Other destinations of note include Vietnam, Colombia, and Egypt. For example, Chinese resin exports to Egypt increased 58% in August to 16,500 tonnes, up by 312% versus the same month in 2023.
EU Bottle-Grade PET Resin Market
Quarterly Imports
EU-27 bottle-grade PET imports (HS Code 390761) totalled 351,000 tonnes in Q2’24, up 24% versus the previous quarter, although 2% lower than Q2’23. Vietnam remained the largest import origin, followed by Turkey, Egypt, and Pakistan.
Imports from Vietnam have surged in 2024 with over 215,000 tonnes in the first six-months. In Q2’24 the EU received around 129,000 tonnes of Vietnamese resin, up by 50% on the previously quarter, and up 78% versus Q2’23.
Volume from Turkey, the second largest origin in Q1’24, decreased 4.5% to 41,000 tonnes, although it was still up 45% versus Q2’23.
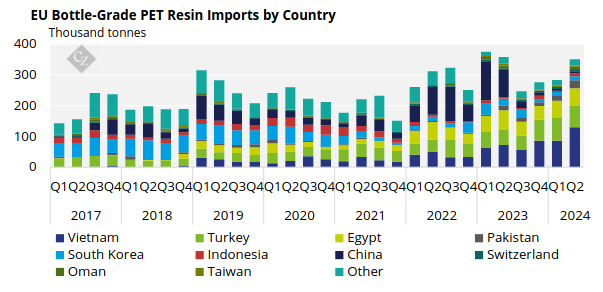
The third largest origin was Egypt with around 57,000 tonnes, broadly on par with the previous quarter. Volumes were down 11% compared to the same period a year earlier. The largest increases were from Pakistan, Indonesia, and Oman, up 81%, 117%, and 1,150% respectively on Q1’24.
Volumes from Pakistan continued to grow strongly, to around 27,000 tonnes. Year-to-date imports from Pakistan were around 42,000 tonnes year-to-date, up 122% on H1’23.
Quarterly Exports
Extra-regional EU-27 PET resin exports bucked the downward trend by rising 16% to around 57,000 tonnes, up 4% on Q2’23.
About 70% of exports out of the EU27 block remained within Europe, destined for the UK, Ukraine and Switzerland. However, this share decreased compared to the previous quarter as producers diversified target markets as operating rates also rebounded.
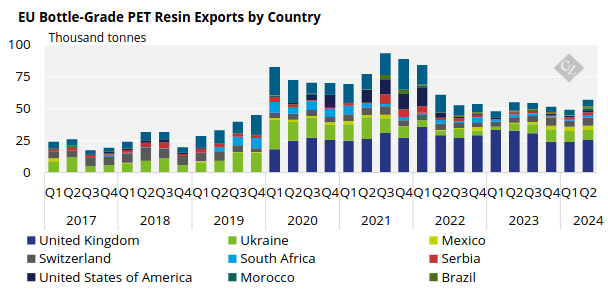
The UK remained the largest destination for PET resin out of the EU bloc, with exports (under HS 390761) steady at around 25,000 tonnes in Q2’24. Quarterly volumes to Ukraine declined by 8% to around 8,000 tonnes, although this was up 51% on the previous year and showed a gradual longer-term recovery trend.
The stand-out destination for growth was Mexico, increasing 35% to 3,300 tonnes, likely linked to the severe droughts and market tightness during this period.
US Bottle-Grade PET Resin Market
Quarterly Imports
US bottle-grade PET imports showed another quarterly decline in Q2’24, totalling 172,000 tonnes, down nearly 9% on the previous quarter, and down 3% on a year earlier.
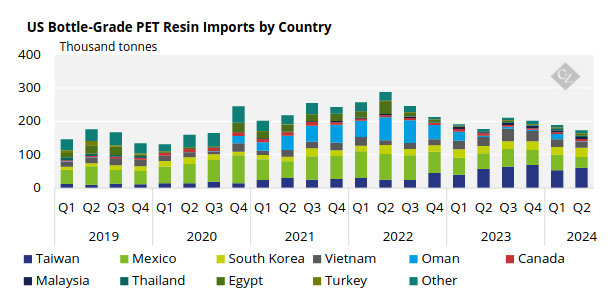
Taiwan, Mexico, South Korea and Vietnam ranked as the largest import origins in Q2’24. Combined, these origins represented around 80% of total US PET resin imports, slightly up on the previous quarter.
Taiwanese resin accounted for the largest share of total imports by volume, with 62,000 tonnes in Q2’24, increasing 17% on the previous quarter and 8% year-to-date.
Mexico ranked as the second largest origin, although imports from Mexico into the US continued to decline, down to 31,000 tonnes in Q2’24, representing a 34% drop versus the previous quarter and 33% down on a year earlier. The main driver was a tighter Mexican PET resin market over this period due to the severe regional drought impacting PET production, as well as stronger US production.
Imports from Vietnam rebounded 24% to around 19,000 tonnes, but volumes were still down 33% versus Q2’23.
Quarterly Exports
Total US bottle-grade PET exports recovered from the previous lows to just under 11,000 tonnes in Q2’24, up 51% versus the previous quarter. Despite the sharp quarterly increase, albeit at relatively low volumes, levels were still 46% below the Q2’23 level.
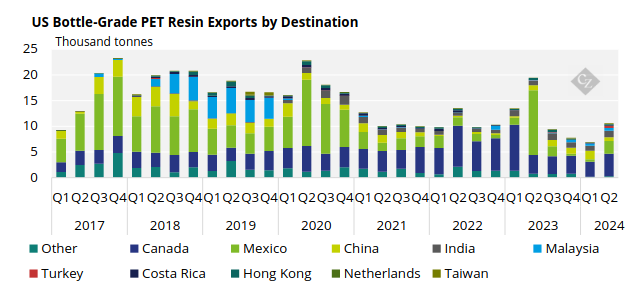
Canada remained the largest end-destination for US PET resin exports, with much of the quarterly volume increase occurring via this lane.
In Q2’24 the US exported around 4,400 tonnes of PET resin to Canada, representing 42% of the US’ total bottle-grade exports. Mexico was the second largest destination for US PET exports, with around 2,500 tonnes in Q2’24. increasing over 450% on Q1’24, although still down 80% from the previous year. Smaller volumes went to India, China, and Malaysia under the same HS code.