Welcome to the sixth instalment of Czapp’s course on futures market spreads. In previous explainers we looked at what a spread is, why they are relevant to market participants and analysts, and what the key drivers of futures market spreads are.
In this explainer we will cover the specific drivers of the No.11 raw sugar futures July-October spread.
No.11 Raw Sugar Futures Contract
There are four No.11 raw sugar futures contracts traded in a calendar year, the March, May, July, and October contracts. This means there are four spread pairs between neighbouring contracts, the October-March (V/H), March-May (H/K), May-July (K/N), and July-October (N/V).
For more information on the No.11 raw sugar futures contract, please see our explainer.
July-October Spread Overview
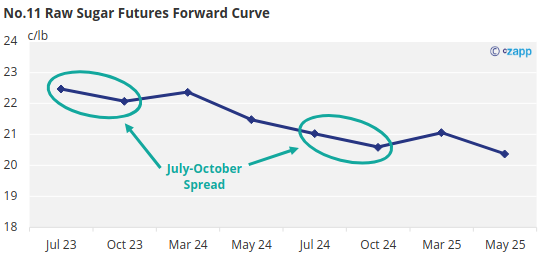
Given the contract months involved, the July-October spread is relevant to supply and demand in the raw sugar market from Q3 to early Q4.
The July-October (N/V) spread tends to be dominated by CS Brazil, sugar cane crushing will be at its peak by this stage in the year.
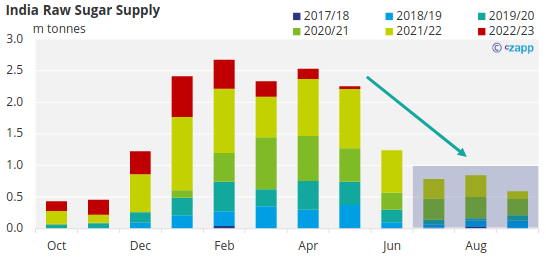
Meanwhile the northern hemisphere producers (India, Thailand, Central America) are usually at the tail end of their season.

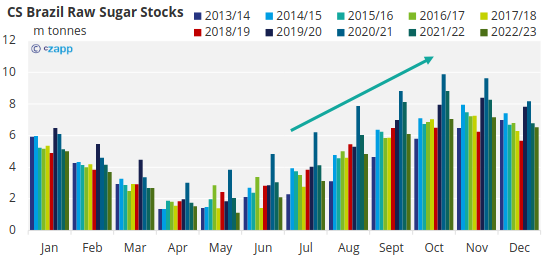
Mills in CS Brazil will be producing sugar at a far greater rate than the internal logistics system will be able to export it. This causes stocks to rise inland.
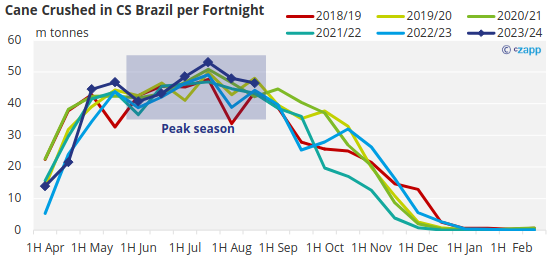
This generally means that the July-October spread is defined by the battle between peak stocks in the Centre-South and the pressure this puts on the logistics in Brazil.
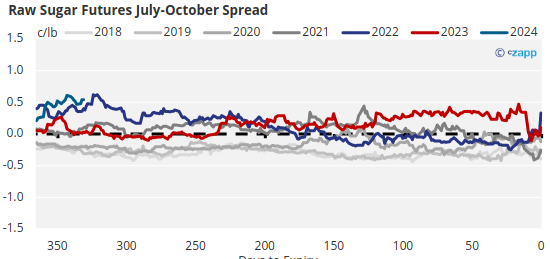
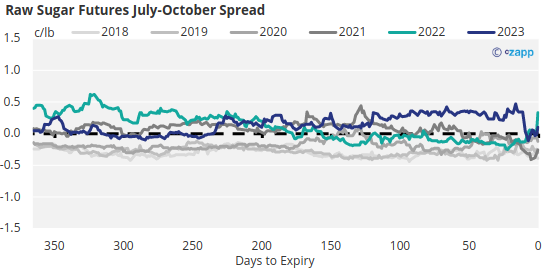
Since the size of the CS Brazil crop, and the extent to which there are logistics bottlenecks both change season by season the July-October spread does not have a common pattern. In some years it trades at a premium, in others a discount.
Who has Sugar to be Delivered into the Expiry?
Sugar priced against the July raw futures contract generally aims to be delivered in Q3. For sugar specifically delivered through the exchange the delivery window is precisely 75 days long, from the 1st of July to around the 15th of September. To understand the distinction here is an explainer on what futures markets are used for.
By July the major northern hemisphere producers will have mostly finished their seasons. This means in a normal year there is generally less sugar available from India, Thailand, or the Central American producers and what is available may still sell at a premium to the futures.
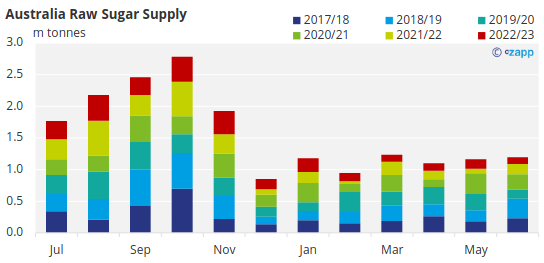
In the southern hemisphere Australia will be in the middle of the crushing season which means it has availability.

However, this sugar is normally sold into the deficit East Asian market at a premium to the futures meaning it is unlikely that this sugar will be delivered though the exchange either.
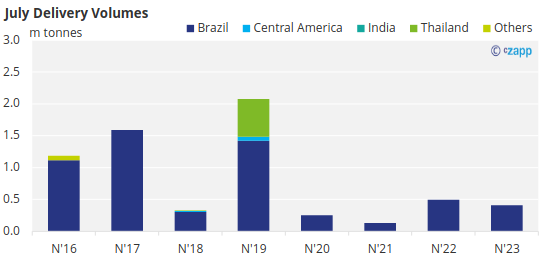
This means that since crushing in CS Brazil will be at its peak it tends to dominate this expiry, with deliveries from other origins often sporadic. For those looking to receive from the exchange should therefore normally expect to take sugar from the same origin.
What Should be Paid Attention to?
Stocks vs logistics in CS Brazil is the key theme of the July-October spread, let’s look at logistics first.
Terminal capacity at the port of Santos (where the majority of sugar in the Centre-South leaves from) can be a major bottleneck to world market sugar exports.
Some terminals are exclusively designated to the elevation of sugar, whereas others share with soybean, corn, and various other commodities. This means the crop size of competing commodities can limit sugar exports.
Soybean competes with sugar in the first few months of the season, from April to around June, then corn exports pick up from July through to around December.
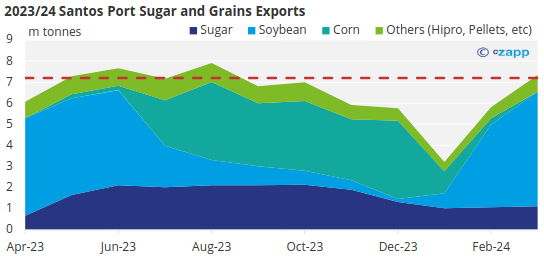
A larger soybean crop can therefore add upside pressure to the July end of the July-October spread, whilst corn the October end of the spread. Aside from the effect felt at the port, greater crop competition also complicates road freight transporting these commodities from inland, adding cost and delays.
Outside of rare circumstances, and with shared terminals prioritising elevating sugar, the port of Santos is able to load around 2.6-2.7m tonnes of sugar per month, roughly half the rate that mills can produce at.
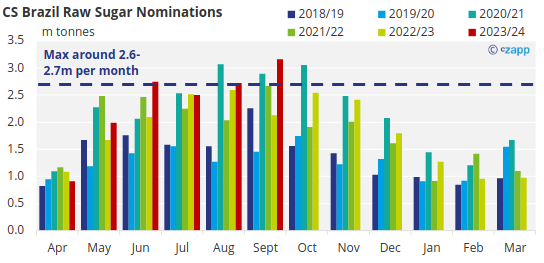
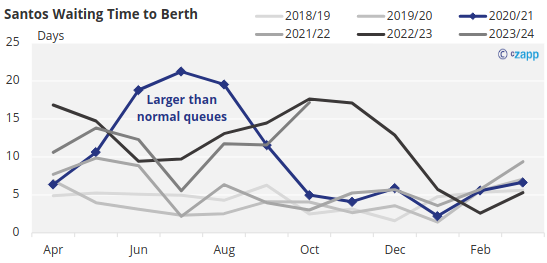
If demand is greater than this vessel queues can form as ships are nominated faster than they can be loaded. When these queues form will influence the July-October spread differently due to the added costs associated with longer wait times.
During the 2020/21 season the vessel queue peaked at 21 days by July but resolved by October, this would have applied positive price pressure to the July end of the spread in that year.
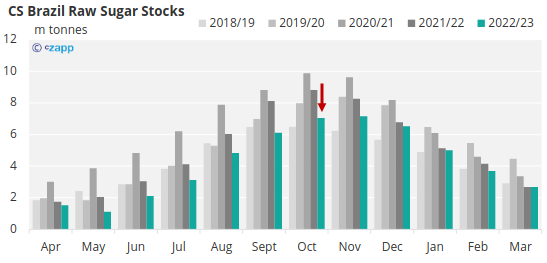
The other half of the equation for the July-October spread is stocks in CS Brazil, particularly the expected stock levels around October since this is generally where they peak in a season and can vary hugely from one season to the next.
Whilst the peak stock level in October won’t be known for certain before the July contract expires, it can be estimated with reasonable confidence in the preceding months.
The consecutive 2022/23, and 2023/24 CS Brazil seasons show how stark the difference can be. 2022/23 was a mediocre year for sugar cane output and ethanol was produced at the expensive of sugar at the start of the season, this added up to only 7m tonnes of stocks by October that year.
Whilst the next season, 2023/24 experienced an excellent sugar cane harvest and sugar was fully prioritized over ethanol throughout, stocks peaked at over 9.5m tonnes in October, over 35% higher than the previous season.
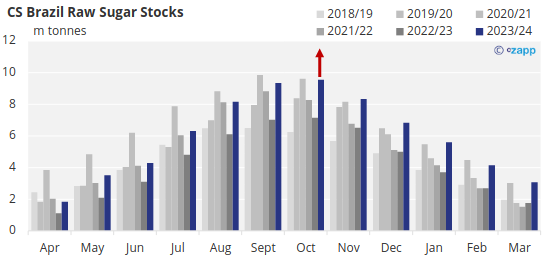
It follows that the 2022 July-October spread faced less downwards pressure on the October contract because of this compared to the 2023 July-October a year later, as such the 2022 spread traded at a premium for the majority of its last 100 days whereas the 2023 spread traded at discount for the majority.
If you have any questions, please get in touch with us at Jack@czapp.com.


